






Biomimetic graphitic carbon nitride nanoparticles for multiscale photomodulation and therapeutic intervention
08/10/2026 MainThe possibility to electrically stimulate living tissue creates new opportunities for therapeutic applications1,2, especially in treating neural and cardiac disorders3,4, provided it can be applied with high spatiotemporal control5. Utilizing excellent spatial and temporal resolution of light, optogenetics through genetically introducing photosensitive channel protein has proven to be a versatile tool to control transmembrane and intracellular bioelectric activity, with high cell-specific selectivity6. However, it requires genetic modifications and concerns immunogenicity from the exogenous transmembrane proteins7.
Interfaces between biology and nanomaterials open an array of possibilities for non-genetic modulation of bioelectric activity with subcellular spatiotemporal control8,9. Nanoparticles (NPs) have shown to be able to build tight interfaces with both intra- and extracellular membranes10,11. Importantly, light can trigger electrochemical or photothermal effects at the semiconductor NP/cellular interface acting as a leadless electrophysiological modulator12,13. Leveraging its unique photocatalytic properties, graphitic carbon nitride (g-C3N4), a polymeric semiconductor, finds applications spanning energy (batteries14 and hydrogen evolution15) to biomedicine (biosensors and cancer therapy)16. Compared with inorganic NP photocatalysts (for example, TiO2 and CoN/CdS)17, g-C3N4 offers improved visible-light absorption, superior biocompatibility and greater photostability in physiological environments. Compared with other organic NPs, such as conjugated polymers18,19 or metal–organic frameworks20, g-C3N4 features intrinsic visible-light responsiveness without requiring complex heterojunction engineering or chemical functionalization21. Furthermore, organic semiconductors often suffer from photobleaching, chemical instability and reduced performance in biological settings, limitations that g-C3N4 materials largely overcome due to their thermal, chemical and photochemical stability. Compared with other photovoltaic systems that typically require large-area implants22, injectability makes NPs a minimally invasive tool for electrophysiological modulation for a broad range of tissues11,18.
Inspired by the double-membrane architecture of chloroplasts23, we choose hollow-sphere g-C3N4 (hg-C3N4) NPs with improved photoelectronic performance24 as a crude mimicry of chloroplast. This biomimetic design enhances electrophysiological modulation at the intracellular and extracellular level, ultimately enabling tissue- and organ-level modulation (Fig. 1a–d). Photocurrent measurements suggest that the photoresponse of hg-C3N4 NPs involves both photoelectrochemical and photothermal components, which collectively contribute to the generation of reactive oxygen species (ROS). The hg-C3N4 NP can be safely internalized with excellent cytocompatibility. The potential of hg-C3N4 as a tool for intracellular light stimulation with subcellular resolution is demonstrated to induce calcium flux in various excitable and non-excitable cells, allowing cell–cell calcium propagation in primary cardiomyocytes (CMs) and cardiac fibroblasts (CFs). Further, the capacity of hg-C3N4 NPs for potential cardiac pacing applications was readily achieved by low-intensity light-emitting diode (LED) light. At tissue and organ levels, intravitreal delivery of hg-C3N4 NPs resulted in measurable cortical and behavioural light responses in a subset of blind rd10 mice, a model of autosomal recessive retinitis pigmentosa.
Fig. 1: Schematic and characterization of hg-C3N4 NPs for versatile multiscale optical biomodulation.
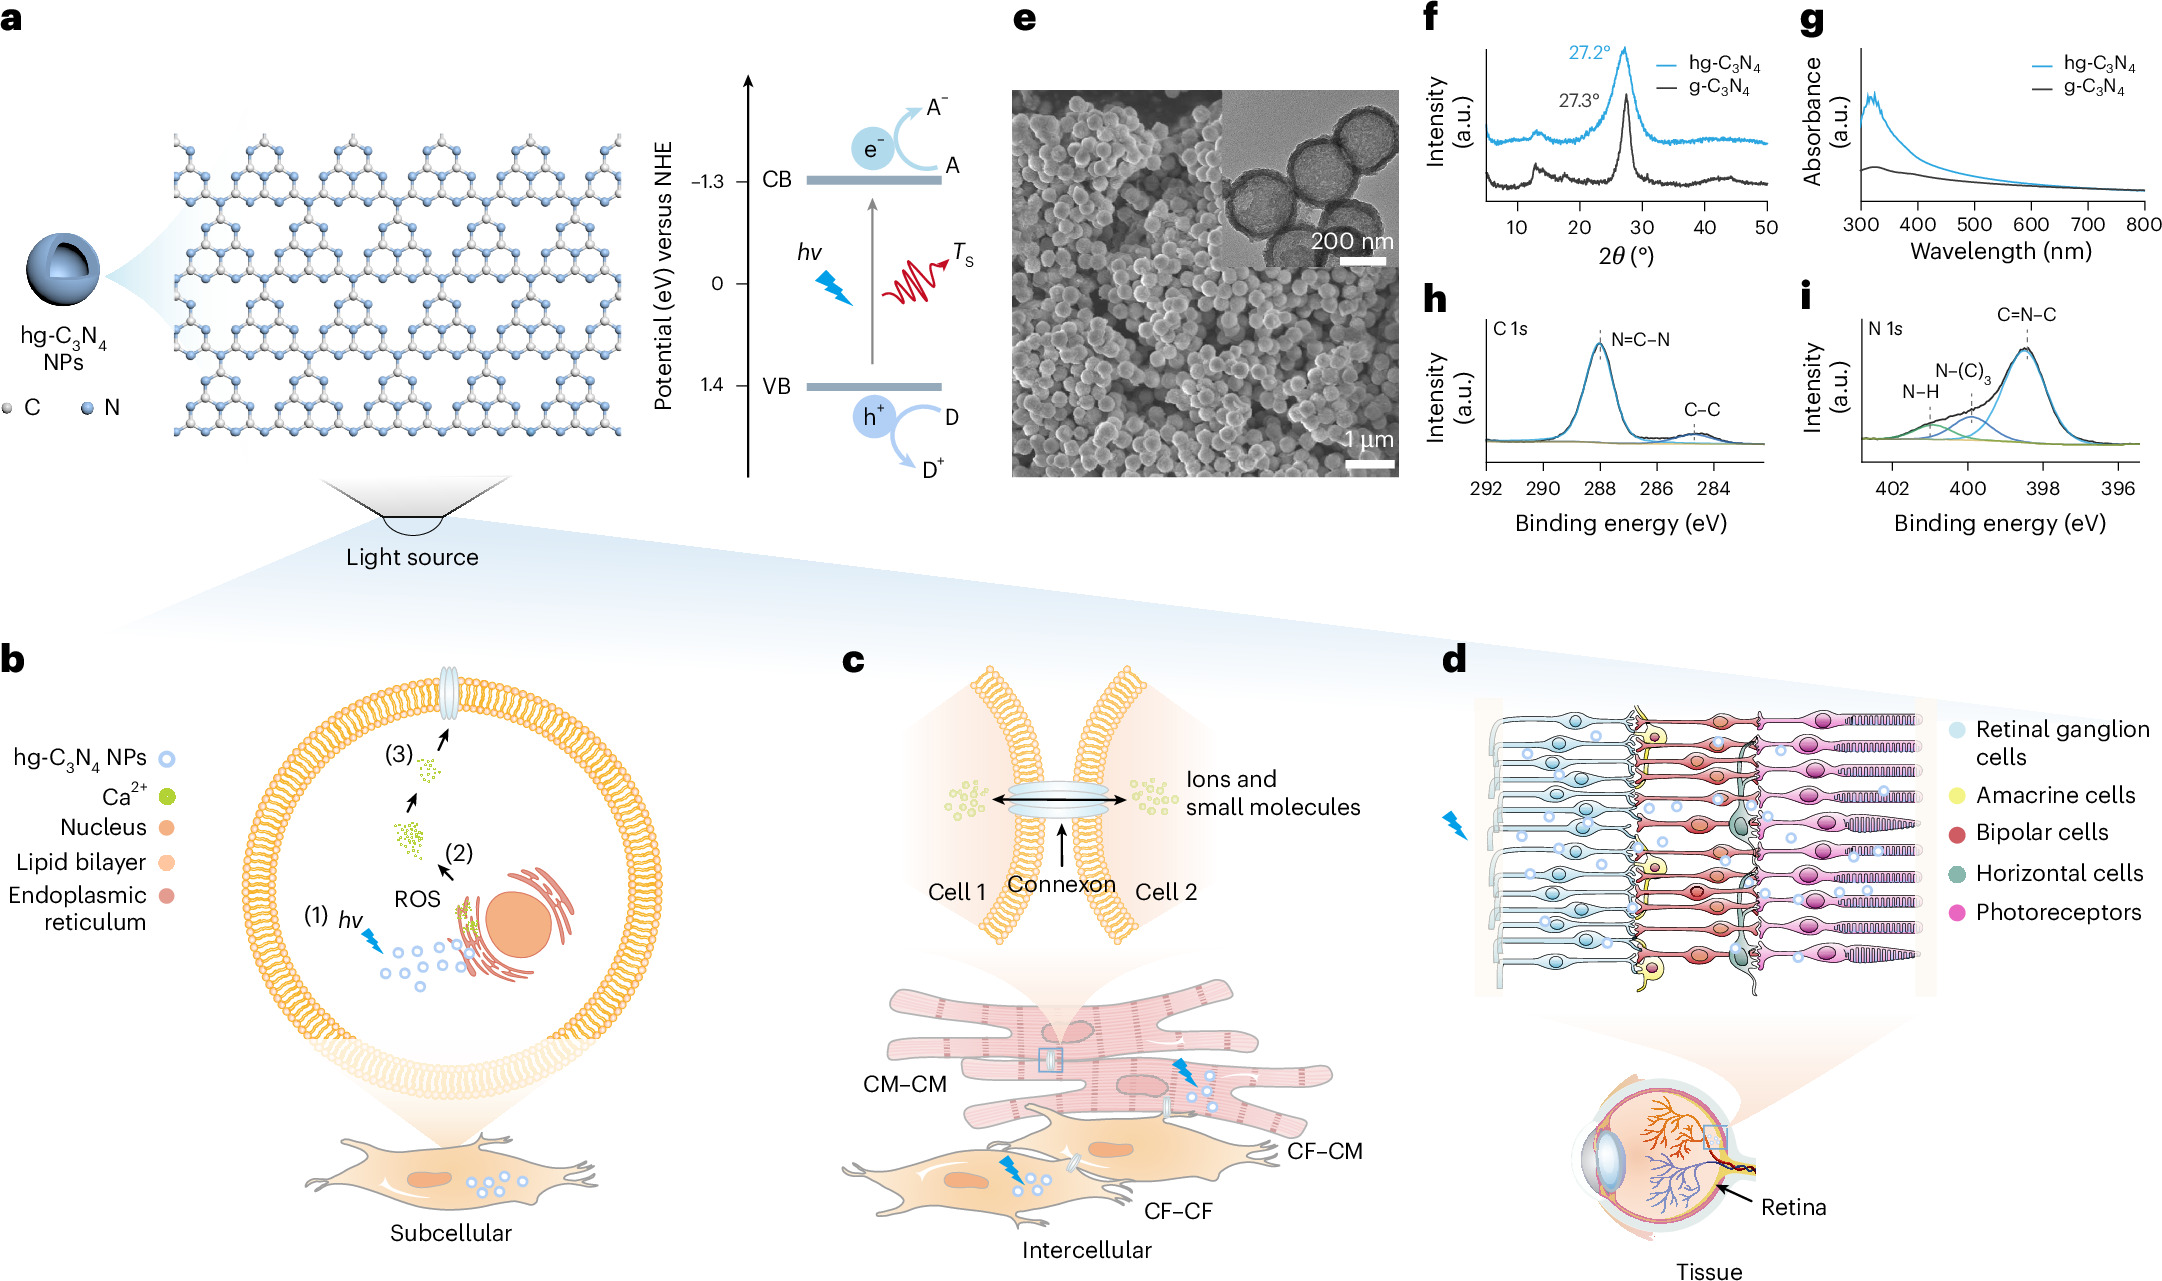
a, The chloroplast-mimicking hollow-sphere (hg-C3N4) NPs with a chemical structure consisting of a covalent triazine network. The bandgap diagram indicates electrons reacting with acceptor (A) compounds and holes reacting with donor (D) compounds, while simultaneously inducing photothermal heating (Ts). NHE, normal hydrogen electrode; CB, conduction band; VB, valence band. b, The proposed mechanism of optical stimulation with subcellular resolution, where photostimulation of hg-C3N4 NPs leads to photofaradaic and photothermal effects together with ROS generation (1). ROS then promotes the ryanodine receptor-mediated calcium release from the calcium-storing organelle, the endoplasmic reticulum (2), leading to intracellular calcium flux through the cytosol (3). c, Photostimulation of hg-C3N4 NPs facilitates intercellular electrophysiological interaction of CFs and CMs. d, hg-C3N4 NPs as injectable retina prosthesis stimulating retinal ganglion cells upon photostimulation. e, SEM and TEM (inset) images of hg-C3N4 NPs. The data are representative of more than three replicates. f, XRD spectra of hg-C3N4 and bulk g-C3N4. g, UV–vis absorption spectrum of hg-C3N4 and bulk g-C3N4. h,i, XPS C 1s (h) and N 1s (i) spectra of hg-C3N4. Credit: b–d, Servier Medical Art under a Creative Commons license CC BY 4.0.
Results
Morphological, photoelectrochemical, photothermal and chemical characterizations of the hg-C3N4 NPs
Scanning electron microscopy (SEM) and transmission electron microscopy (TEM) were used to verify the hollow sphere structure of hg-C3N4 NPs with an inner diameter of around 233 ± 14 nm, an outer diameter of 306 ± 20 nm and a shell of around 73 ± 14 nm (Fig. 1e). The X-ray diffraction (XRD) spectra (Fig. 1f) shows a (100) reflection peak at ~13° for both g-C3N4 and hg-C3N4, indicating the in-plane periodic arrangement of triazine/heptazine units. The (002) peak of g-C3N4 at 27.3°, corresponding to interlayer stacking, shifts slightly to 27.2° for hg-C3N4, indicating an increased interlayer distance from 0.326 nm to 0.328 nm, confirming structural modification. The great light harvesting properties of hg-C3N4 NPs are shown, where hg-C3N4 NPs showed around three times higher light absorbance within a range of 350–600 nm (Fig. 1g), attributed to multiple reflection sites residing in the hollow structure, prolonging the light path length for absorption within the spheres24.
The X-ray photoelectron spectroscopy (XPS) C 1s spectrum shows N=C–N (288.0 eV) and sp2-hybridized C–C bonds (284.7 eV) (Fig. 1h). The N 1s spectrum reveals three components corresponding to C=N–C (398.5 eV), N–(C)3 (399.9 eV) and N–H (400.9 eV), confirming the chemical environment of nitrogen atoms in the structure (Fig. 1i). Energy-dispersive X-ray spectroscopy elemental mapping (Supplementary Fig. 1a) confirms the uniform distribution of C and N elements throughout the hg-C3N4 sample, supporting its compositional homogeneity.
Dynamic light scattering (DLS) and zeta-potential measurements (Supplementary Fig. 1b) illustrate the stability of NPs in diverse media25, including phosphate-buffered saline (PBS) and cell culture medium, monitored over 12 days. In PBS, the size of hg-C3N4 NPs at day 0 and day 12 is comparable to that of the single NP. In parallel, a decrease in the zeta potential of NPs after 12 days suggests the formation of an ion corona, which may have enhanced the stability of the hg-C3N4 NPs suspension. In Dulbecco’s modified Eagle medium (DMEM) with 10% FBS, an increase in particle size and a minor change in the zeta potential suggest the formation of a protein corona26 that may have shielded a portion of the charges on the particles. The formation of a protein corona can lower the surface energy of hg-C3N4 NPs and promote their dispersion in biological fluids27.
Leadless bioelectric stimulation using photoresponsive particles relies on photoelectrochemical or photothermal effects to modulate cellular bioelectric activity12,28 (Fig. 2a). Patch-clamp electrophysiology was used to measure the photocurrent from the hg-C3N4 NP aggregates (Fig. 2b). As photothermal effects increase temperature, increased ion mobility reduces pipette resistance, thereby increasing the current, which is directly proportional to the amplitude of the applied holding current (I0). On the other hand, photoelectrochemical processes, such as capacitive and faradaic currents, are independent from the I0 (ref. 29). While the direct photocurrent recordings show noisy signals (Fig. 2c,d), the non-zero intercept and the slope of photocurrent amplitudes across holding currents (Fig. 2e) indicate the presence of minor anodic currents and a transient temperature increase of approximately ΔT = 0.2325 °C at the pipette tip. Together, these findings suggest the coexistence of photoelectrochemical and photothermal effects. While a less pronounced anodic current was observed under a 10-ms, 625-nm light pulse (Fig. 2c), the sustained negative current (–30 pA at I0 = 0 nA) throughout the 100-ms, 365-nm pulse (Fig. 2d) suggests a possible anodic faradaic response, in contrast to capacitive currents characterized by rapid charge–discharge dynamics. These results confirm the coexistence of photothermal and faradaic effects under illumination29, consistent with observations in other nanotransducers for photostimulation30.
Fig. 2: Photocurrent characterization.

a, A scheme of the hg-C3N4 NPs stimulation mechanism based on anodic faradaic photocurrent and photothermal effect. Ts, light-induced heating. b, An illustration of the patch-clamp photoresponse measurement setup used to measure the photocurrent. Rfeedback, feedback resistance; Vout, output voltage. c,d, Photocurrent traces measured for a range of holding currents (I0) under LED illumination at 45 mW mm−2 intensity, with 625-nm 10-ms (c) and 365-nm 100-ms (d) pulse durations. e, Photocurrent amplitudes for a range of holding currents. Data are shown as means ± s.d. (n = 3 independent experiments). f, Quantification of hg-C3N4 NPs produced H2O2 under visible-light LED illumination (450 nm, 75 mW cm−2). Data are presented as mean ± s.d. (n = 3 independent concentration-normalized measurements per condition). Statistical analysis was performed using a two-tailed unpaired t-test.
The quantification of H2O2, generated via photoelectrochemical or photothermal effect31,32 (Fig. 2f and Supplementary Fig. 2a) revealed a clear dose-dependent increase in H2O2 production. Under blue-light irradiation (450 nm, 75 mW cm−2) for 30 min, approximately 30 µM of H2O2 was generated per milligram of hg-C3N4, while no H2O2 was detected in the absence of light. These results further suggest the light-induced faradaic process.
Using electron spin resonance (ESR)33, a more direct and chemically specific method compared with fluorescent probes, the presence of intermediate ROS radicals, superoxide anion •O2−, hydroxyl radicals •OH and singlet oxygen 1O2 was detected (Supplementary Fig. 2b–d). This suggests an electrochemical process that produces H2O2 through the oxygen reduction pathway, which reduces O2 to •O2−, or through the water oxidation reaction, which oxidizes H2O to •OH, or both34. Owing to the inferior oxidation capability of hg-C3N4, formation of •OH is most likely attributed to H2O2 photolysis into •OH, or to Fenton-like reaction promoted by photothermal effects35. 1O2 can be formed by the deactivation of O2•− on the photocatalyst surface36. Therefore, the reduction of oxygen to •O2− is the major contributor for H2O2 formation through subsequent reaction with H+.
Incubated with a redox-sensitive probe (DCFH-DA) and upon blue-light exposure (10 mW cm−2) for 10 min, NIH/3T3 fibroblasts treated with hg-C3N4 showed a significant increase in fluorescence relative to controls, demonstrating that ROS production translated into intracellular oxidative signalling (Supplementary Fig. 3).
Particle internalization and cytocompatibility
We then investigated whether hg-C3N4 NPs were efficiently internalized by mammalian cells and their intracellular trafficking properties, using our toolboxes37,38,39. Single NIH/3T3 fibroblasts labelled with a membrane marker were monitored (Fig. 3a and Supplementary Fig. 4a) and the increase of inherent blue fluorescence hg-C3N4 NPs over time showed their evident, albeit slow, internalization (Fig. 3a,c). Similar particle uptake was observed qualitatively in R28 retinal cells (Fig. 3b and Supplementary Fig. 4b). Definitive intracellular localization was confirmed using volumetric imaging in NIH/3T3 cells, which further showed the hg-C3N4 NPs to colocalize with lysosomes after prolonged exposure (Fig. 3d and Supplementary Video 1).
Fig. 3: Internalization and cytocompatibility of hg-C3N4 NPs.
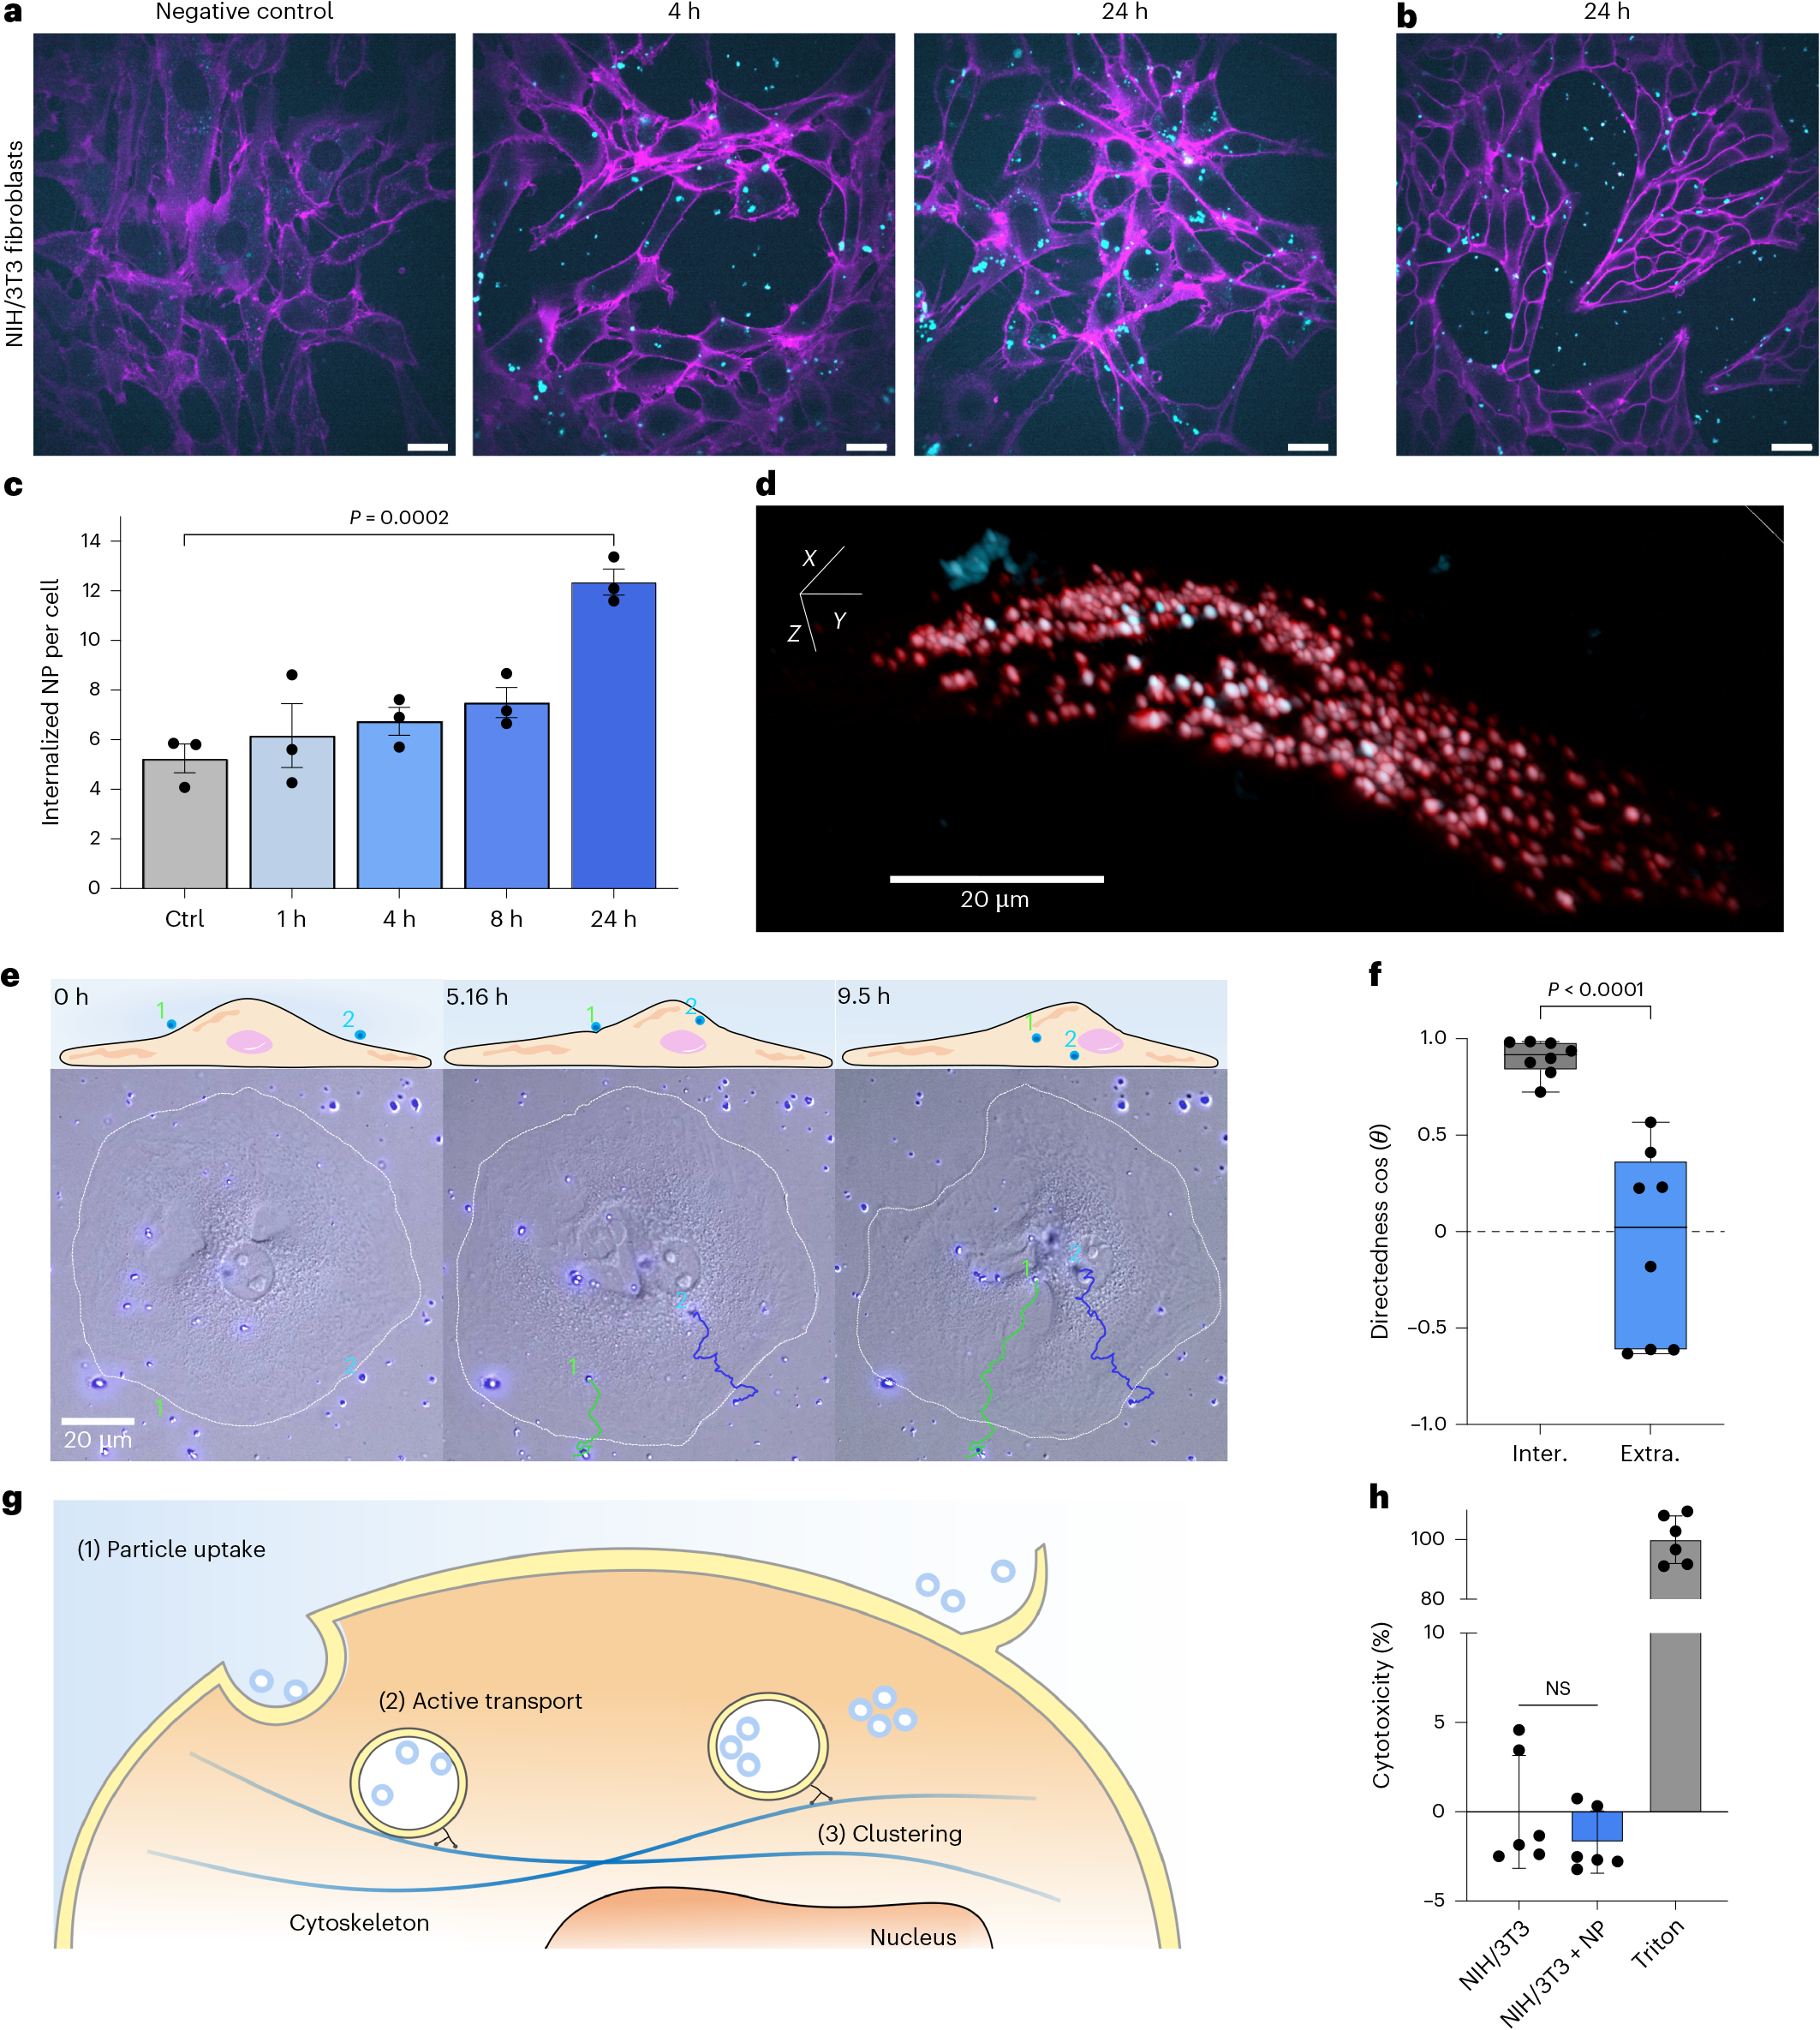
a, Live-cell images of the time-dependent internalization of hg-C3N4 NPs (cyan) in NIH/3T3 fibroblasts (plasma membrane labelled in magenta), acquired using a spinning-disk confocal microscope. Scale bars, 20 µm. b, Representative live-cell image of hg-C3N4 NP uptake in R28 retina cells acquired in the same manner as in a. Scale bar, 20 µm. c, Quantification of hg-C3N4 NPs internalization in NIH/3T3 fibroblasts. Data are presented as mean ± s.d. (n = 3 biologically independent experiments; n > 500 cells per condition). Statistical analysis was performed using a one-way ANOVA followed by Dunnett’s multiple comparisons test. Ctrl, control. d, A 3D view acquired by lattice light-sheet microscopy of a single NIH/3T3 fibroblast showing internalized hg-C3N4 NPs (cyan) and lysosomes (red), with colocalization shown in white. Scale bar, 20 µm. e, Tracking of two representative hg-C3N4 NPs internalized by a NIH/3T3 cell over time. f, Quantification of directedness for internalized (intra.) and non-internalized (extra.) NPs. Data are presented as box plots showing the median (centre line), interquartile range (box bounds) and whiskers extending to minimum and maximum values (n = 8 particles per condition). Statistical analysis was performed using a two-tailed unpaired t-test. g, A schematic of the proposed internalization and intracellular trafficking mechanism. h, LDH cytotoxicity assay of hg-C3N4 NPs in NIH/3T3 fibroblasts. Data are presented as mean ± s.d. (n = 6 independent measurements). Statistical analysis was performed using one-way ANOVA followed by Tukey’s multiple comparisons test. NS, not significant.
Tracking of the particles revealed a clear directionality from the extracellular space towards the perinuclear space (Fig. 3e,f, Supplementary Fig. 4c and Supplementary Video 2). Internalized particles exhibited a median cos(θ) value of 0.91, corresponding to movement within ±25° towards the nucleus, whereas non-internalized particles showed broadly distributed cos(θ) indicative of random motion40 (Fig. 3f).
To investigate the uptake pathways41,42 involved, we performed chemical inhibitor assays43. While chloroquine showed a slight decrease across all biological replicates, no single inhibitor was able to significantly reduce internalization (Supplementary Fig. 4d and Supplementary Table 1).Combined with the observed trafficking behaviour, these findings suggest that the hg-C3N4 NPs are internalized through multiple pathways, including both phagocytosis- and endocytosis-driven mechanisms44,45 (Fig. 3g), followed by active trafficking within endosomal compartments towards the perinuclear region45.
To assess the cytocompatibility of hg-C3N4 NPs, lactate dehydrogenase (LDH) release was used as a basal cytotoxicity assay in NIH/3T3 cells incubated with the NPs, which did not reveal any considerable cytotoxic effects of hg-C3N4 NPs in NIH/3T3 cells (Fig. 3h). In addition, Live/dead staining of NIH/3T3 fibroblasts following high-intensity light exposure (450 nm, 75 mW cm−2, 1 Hz, 100-ms pulse width, 10 min twice daily) did not reveal detectable phototoxic effects compared with non-illuminated controls (Supplementary Fig. 5a,b). Light exposure led to a transient reduction in proliferation at day 3; however, proliferation recovered by day 8 in the presence of hg-C3N4 NPs (Supplementary Fig. 5c). As high-intensity blue light has previously been reported to negatively affect cellular viability46, all subsequent experiments were performed using lower light intensities (10–30 mW cm−2). To exclude the effects of cell division, acute LDH assays and live/dead staining following repeated photostimulation over 7 days were additionally performed in non-dividing human induced pluripotent stem cell-derived CMs (iPS cell-CMs), in which minimal toxicity was observed (Supplementary Fig. 6).
Biological modulation at the subcellular and cellular levels
Subcellular photostimulation of non-excitable cells
The ability of the particles to induce light-triggered intracellular bioelectric activity with subcellular resolution was investigated by monitoring calcium flux under focused laser beam stimulation of single internalized particles. hg-C3N4 NPs showed strong fluorescence in the green channel, enabling simplified identification of internalized hg-C3N4 NPs. A focused 473-nm (8.8 mW µm−2) laser beam with a pulse width of 200 ms and subcellular spot size of 3 µm was used to stimulate the particles. The laser pulse alone could not provoke any change in calcium dynamics in NIH/3T3 fibroblasts (Supplementary Video 3). When particles were present, photostimulation led to an immediate calcium flux through the cytosol originating from the stimulated particle location (Fig. 4a and Supplementary Videos 4 and 5), with an average calcium flux velocity of 2.4 ± 3.8 µm s−1.
Fig. 4: Subcellular and intercellular photomodulation.

a,b, Intracellular electrical interrogation of NIH/3T3 fibroblasts (a) and HeLa cells (b) with the corresponding isochronal and vector maps. The inset in a shows the proposed calcium release mechanism based on calcium-storing ER. c–e, Intercellular calcium propagation with corresponding isochronal maps or calcium staining with ΔF/F0 plots between CFs (c), between CF and CM (d) and between CMs (e). The data are representative of three replicates. Scale bars, 10 µm. The red arrows indicate the location of the 200-ms laser pulse, 473 nm, spot size 3 µm, 8.8 mW µm−2. Credit: illustrations, Servier Medical Art under a Creative Commons license CC BY 4.0.
For HeLa cancer cells, a single 200-ms laser pulse led to an immediate intracellular calcium flux with a prolonged increase in intracellular calcium (Fig. 4b), evident by the sustained increase in fluorescence intensity (Supplementary Videos 6 and 7), with the average velocity of the calcium flux of 1.3 ± 2.7 µm s−1. Extended recording up to 50 s (Supplementary Fig. 7) revealed detailed kinetics, including the time-to-peak (≈1.9 s) and decay constant (τ ≈ 27.7 s), demonstrating that the cytosolic Ca2+ signal persists well beyond the original 8-s window.
Photostimulation of excitable cells and intracellular signal propagation
We then examined excitable cells such as primary rat CM and primary rat CFs47,48. A stimulated primary CF propagated the calcium transient to an adjacent CF with a velocity of 8.8 ± 16.2 µm s−1 (Fig. 4c and Supplementary Video 8). Stimulation of a primary CF adjacent to CM led to a similar observation, supporting direct coupling of CMs and CFs via connexin-based gap junctions49,50; when the intracellular calcium flux of the fibroblast reached the outer cell membrane with 4.4 ± 8.5 µm s−1, the adjacent CM began continuous beating (Fig. 4d and Supplementary Video 9). Directly stimulated CMs exerted immediate intracellular calcium flux and beating (Fig. 4e and Supplementary Video 10). Furthermore, the calcium flux of the stimulated cell propagated to three adjacent coupled CMs50.
Consistent with the absorbance spectrum of hg-C3N4 NPs, when irradiated with a wavelength >500 nm (635-nm laser), CM cells showed negligible changes in intracellular calcium signalling compared with the pronounced response observed with 473-nm illumination (Supplementary Fig. 8 and Supplementary Videos 11 and 12).
Noticeably, the photocurrent generated by hg-C3N4-coated substrates under repeated 473-nm laser pulses is highly stable across multiple on–off cycles (Supplementary Video 13).
Molecular pathway of calcium release
To rigorously determine the molecular pathway underlying the observed calcium elevation, we employed a series of pharmacological inhibitors that isolate the functional contributions of ROS, endoplasmic reticulum (ER) calcium channels and membrane ion channels, providing mechanistic clarity.
Pretreatment with 500 µM N-acetylcysteine (NAC), a ROS scavenger, completely suppressed the calcium response in CMs (Supplementary Fig. 9 and Supplementary Video 14), demonstrating that intracellular ROS generation is essential for triggering calcium release.
Using 10 µM Ruthenium Red, a nonspecific blocker of transient receptor potential (TRP) channels, calcium transients remained intact (Supplementary Fig. 9 and Supplementary Video 15), excluding the contribution of thermosensitive TRPV/TRPM family channels9,51,52,53,54 and arguing against a photothermal membrane-gating mechanism.
To test whether the inositol-triphosphate receptor (IP3R) and/or the ryanodine receptor (RyR)55,56 are directly responsible for calcium release from ER, we pretreated cells with 25 µM ryanodine, a RyR inhibitor, and 200 µM 2-APB, an inhibitor of IP3-mediated ER calcium release, respectively. While no notable calcium flux was observed after ryanodine treatment (Supplementary Fig. 10 and Supplementary Video 16), 2-APB-treated cells still exhibited robust calcium transients following stimulation (Supplementary Fig. 10 and Supplementary Videos 17 and 18). This confirms that the RyRs on the ER membrane are the key mediators of intracellular calcium release in our system. Moreover, the presence of continued spontaneous calcium oscillations in the presence of 2-APB and the absence of global fluorescence loss argues against nonspecific ER rupture as the source of calcium release.
Finally, the calcium response remained robust in supplemented Ca2+-free Hanks’ balanced salt solution (HBSS) (Supplementary Fig. 11 and Supplementary Video 19), confirming that the source of Ca2+ is entirely intracellular and independent of store-operated calcium entry or voltage-gated calcium channels. By contrast, when examined in non-excitable cells such as HeLa, light-evoked responses were only diminished in Ca2+-free media (Supplementary Fig. 12), suggesting a contribution from extracellular Ca2+ in non-excitable cells57.
Interval training of CMs
As the stimulation of single CMs via laser has proven feasible, we next applied interval training to many CMs simultaneously to synchronize beating using a low-intensity LED light source (10 mW cm−2, λ = 450 nm). After 10 min LED photostimulation (1 Hz and 100-ms pulse width), the beating frequency of the NPs treated HL-1 changed from an irregular non-synchronized pattern between 0.5 and 2 Hz to a more synchronized pattern of 2 Hz (Fig. 5a,b). This effect was even more pronounced after 30 min of stimulation. As no decrease of beating frequency has yet been achieved in pacing experiments51,53,58, it suggests that mice CMs were trained (1 Hz) at their every second beat to achieve a final beating rate of 2 Hz.
Fig. 5: Pacing of CMs via photostimulation of hg-C3N4 NPs.
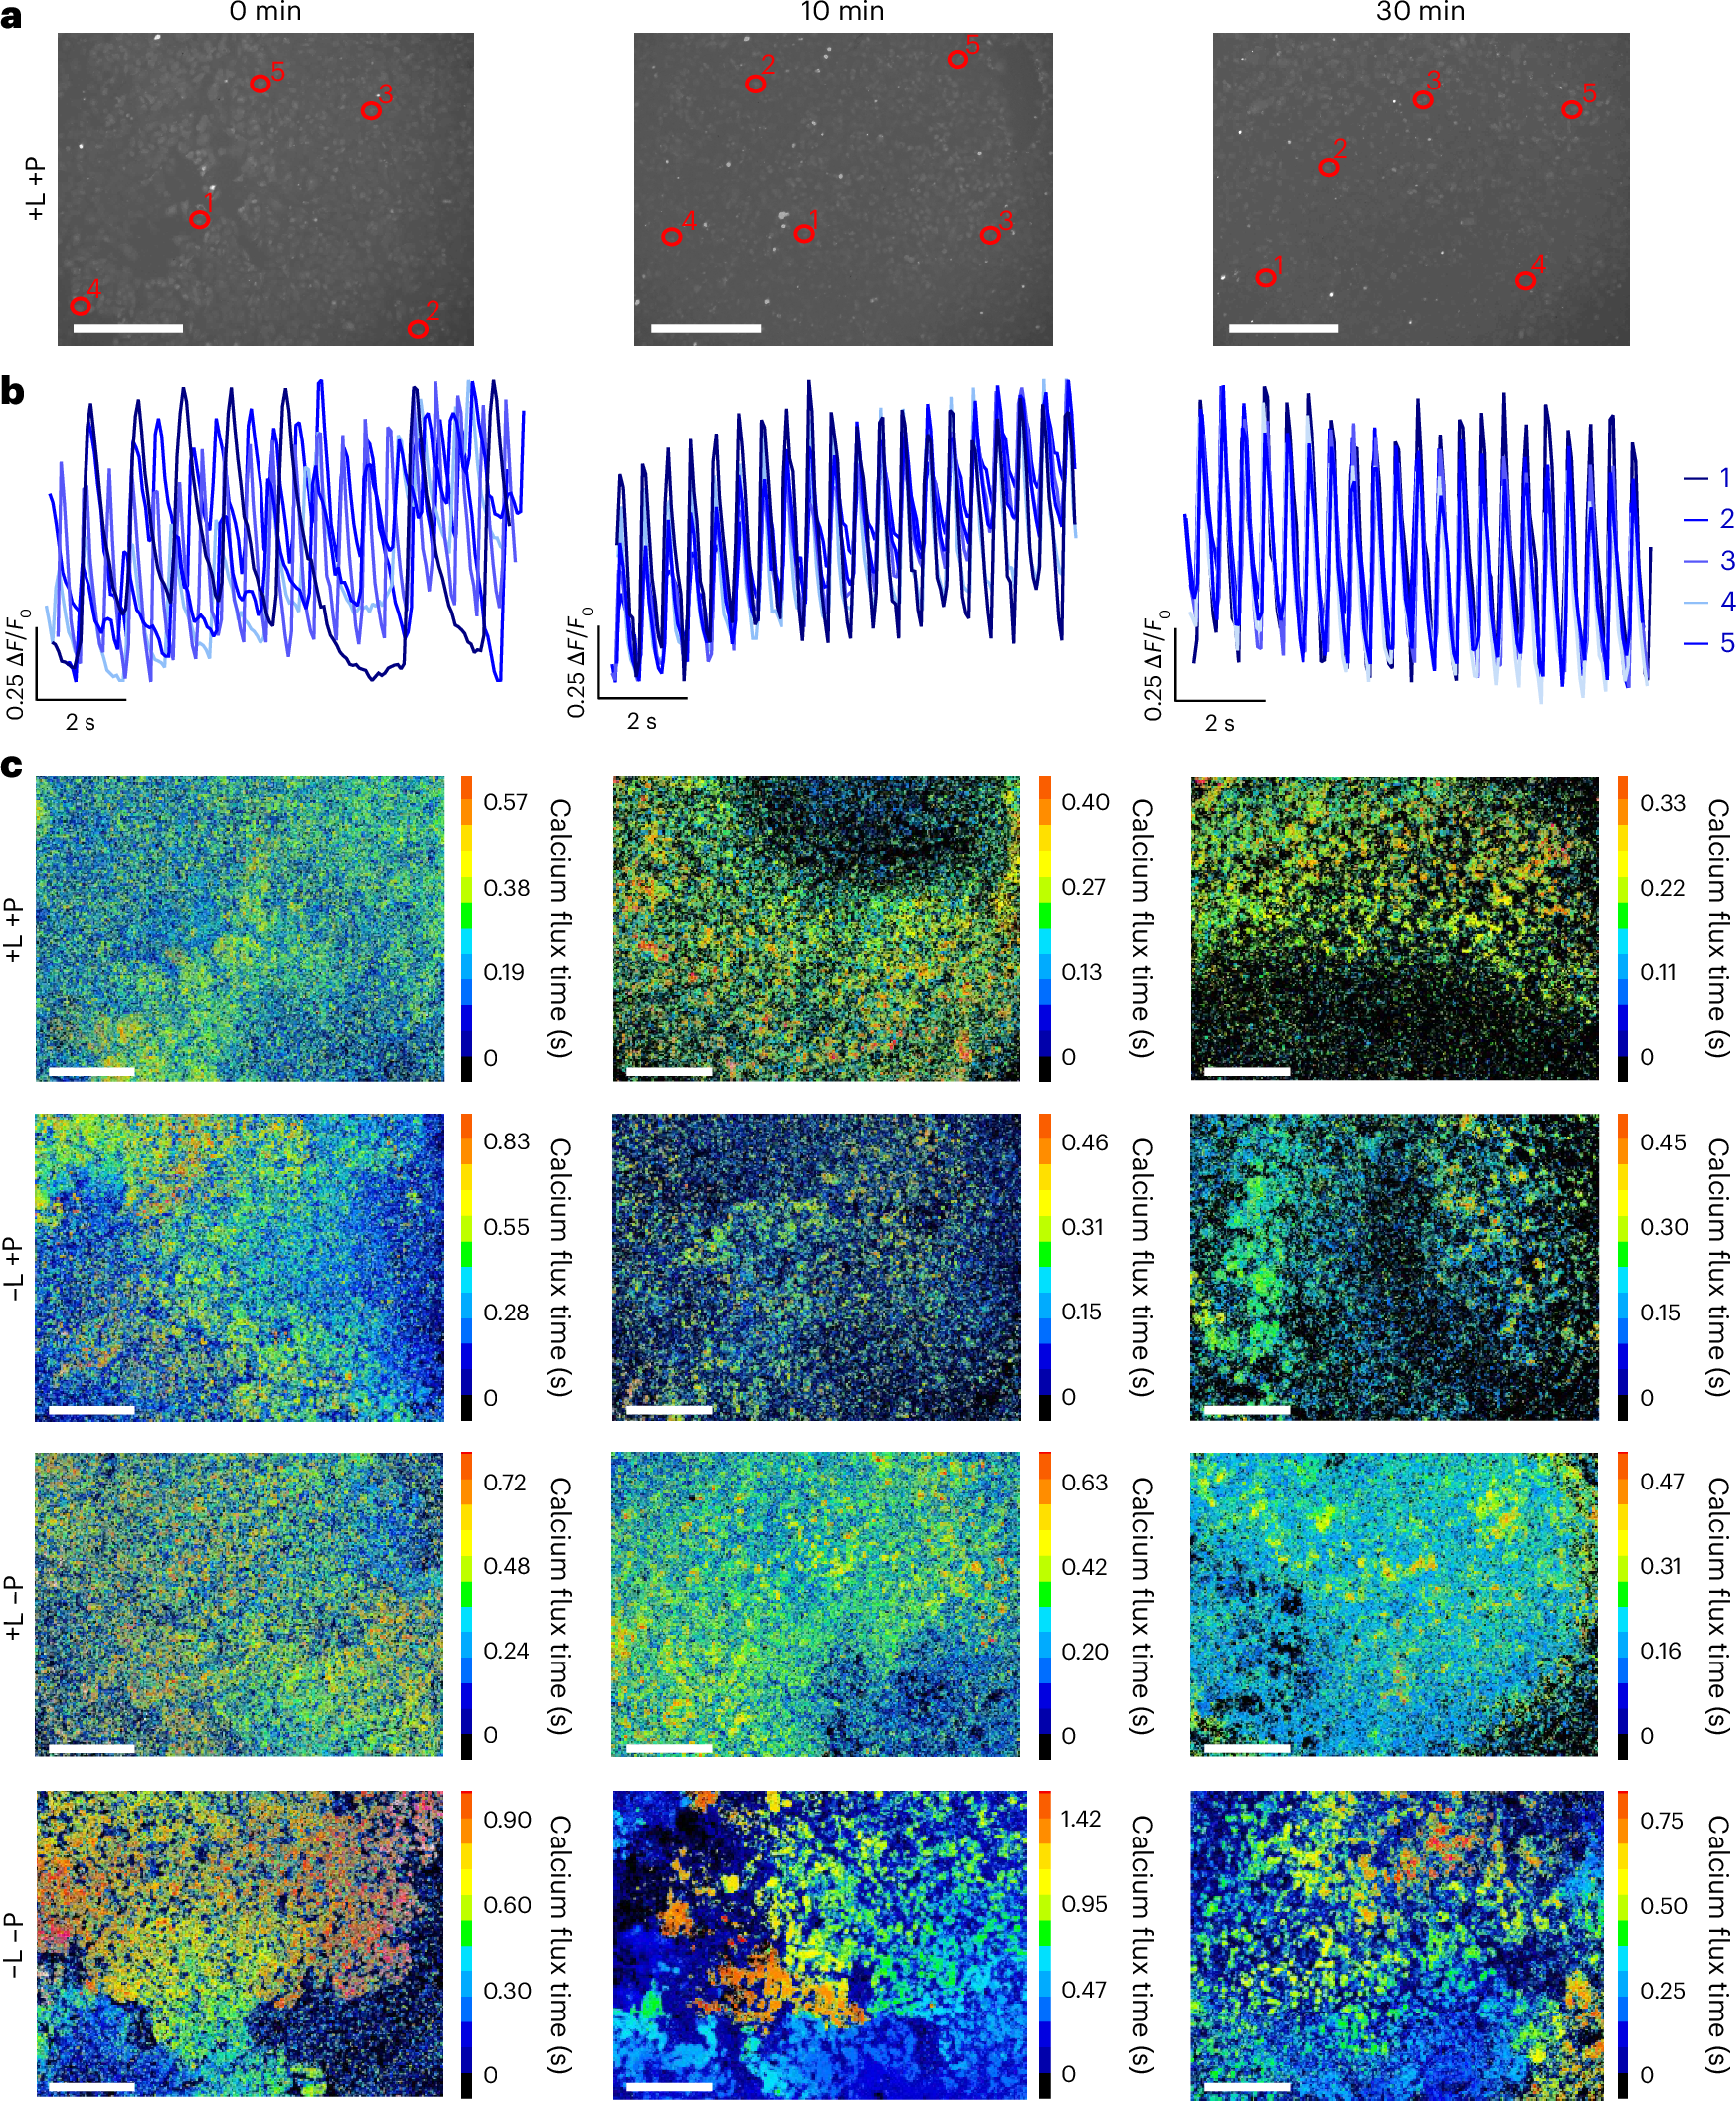
a, HL-1 cells stained with Fluo-4 calcium stain incubated with 2.0 µg cm−2 hg-C3N4 NPs (+P) and photostimulation (+L) at 0 min, 10 min and 30 min. The red circles indicate ROIs for ΔF/F0 plots. The data are representative of three replicates. b, ΔF/F0 traces from five ROIs showing beating activity of photostimulated HL-1 cells. c, Isochronal maps of HL-1 cells incubated with or without hg-C3N4 NPs (+P and −P, respectively) and with or without photostimulation (+L and −L, respectively). Photostimulation was performed using blue LED light at 1-Hz frequency (450 nm, 10 mW cm−2, 100-ms pulse width). Scale bars, 275 µm.
Further, the calcium flux appeared to travel as a directional synchronized wave through the CM sheet (Fig. 5c and Supplementary Videos 20–22). CMs cultured without hg-C3N4 NPs remained unsynchronized. Light stimulation alone led to an increase in beating frequency around 1.5 Hz; however, without synchronization and directionality of the calcium wave (Supplementary Fig. 13).
Furthermore, light-induced biomodulation of human iPS cell-CMs showed a consistent increase and stabilization at the targeted 1-Hz beating frequency (450 nm, 30 mW cm−2, 1 Hz, 50-ms pulses) (Supplementary Fig. 14 and Supplementary Videos 23 and 24). The injectability of NPs makes them an attractive non-invasive alternative to conventional electronic pacemaker therapy.
Propagation mechanism
To elucidate the contribution of ATP secretion and gap junctions for the propagation of intercellular Ca2+ waves59, HL-1 cells were pretreated with either apyrase, an ATP-hydrolysing enzyme or carbenoxolone (CBX), a gap-junction inhibitor, for 15 min before a round of light stimulation (450 nm, 10 mW cm−2, 1 Hz, 100-ms pulses, 10 min). Apyrase showed no significant effect on Ca2+ wave dynamics, while CBX significantly reduced wave propagation and disrupted its directionality (Supplementary Fig. 15 and Supplementary Videos 25–27). These findings suggest that gap junctions play a dominant role in mediating Ca2+ wave propagation in our system.
Therapeutic intervention
Here, we explore the potential of hg-C3N4 NPs as an injectable retinal prosthesis60 using living mice as well as porcine retina ex vivo. First, a 30-day incubation in simulated physiological conditions (pH 4.5 and 7.0) showed that hg-C3N4 NPs retained their structural integrity, shape and dispersion characteristics (Supplementary Fig. 16).
We next assessed biodistribution and retinal integrity following intravitreal delivery to wild-type (WT) C57BL/6JRj mice (Fig. 6a). The intravitreal injection of hg-C3N4 NPs into mouse eyes resulted in the visible settlement of particle aggregates on the retinal surface immediately adjacent to the retinal ganglion cells (RGCs) and their axons, as observed in fundus images and optical coherence tomography (OCT) scans 14 days post-injection (Fig. 6b). OCT imaging demonstrated preserved retinal layer integrity (Fig. 6b,c), where neither total retinal thickness (P = 0.57) nor individual layers thicknesses differed significantly between baseline and day 14 post-injection. The hg-C3N4 NPs could be clearly identified on top of the RGCs using fluorescence imaging of retinal cross sections (Fig. 6d–f).
Fig. 6: Intravitreal delivery of hg-C3N4 NPs preserves retinal structure and gene expression.

a, A schematic drawing of the intravitreal injection procedure and experimental timeline. b, Representative fundus images and OCT B-scans from eyes intravitreally injected with hg-C3N4 NPs (NP intravitreal (IVT)) or buffer (PBS IVT). The integrity of the retinal layers is preserved and hyper-reflective spots corresponding to aggregated NPs (white arrowheads) can be observed in the vitreous and on the retinal surface. Scale bars, 200 µm. c, The position of retinal borders in the NP IVT eyes at baseline and day 14 (D14; mean ± s.d.) with corresponding comparisons of the mean thickness across individual retinal layers (n = 6 samples). RGCL, retinal ganglion cell layer; NGI, the combined thickness of retinal nerve fibre layer, ganglion cell layer and inner plexiform layer; INL, inner nuclear layer; OPL, outer plexiform layer; ONL, outer nuclear layer. Comparisons were performed using a paired two-tailed t-test. d,e, Widefield fluorescent images (20×) from the mice shown in b (NP IVT (d) or PBS IVT (e)) labelled with the RGC marker RbPMS (red) and counterstained with Draq5 (yellow). The blue fluorescent NPs (white arrowheads) are attached to vitreous strands and the retinal surface. The orange signal detected in the outer segments is attributable to autofluorescence. f, Confocal microscopy images (63×) of retinal cross sections labelled with the RGC marker RbPMS (red). Blue fluorescent NPs (white arrowheads) are seen on the inner retinal surface near the RGCs. In some areas, NPs were engulfed by rounded cells, presumably hyalocytes (white arrow). Representative images from n = 6 NP-injected eyes and n = 2 PBS-injected eyes. g, Total retinal RNA was isolated from mice treated with NPs (n = 5 eyes) or PBS (n = 5 eyes) at day 14 post-injection. Purified RNA was subjected to RNA-sequencing and principal component analysis. PC1, principal component 1; PC2, principal component 2. h, A heat map showing gene expression patterns (n = 5) across relevant pathways denoted by the rainbow scale: red, photoreceptor and RGC health; yellow, oxidative stress response; green, apoptosis; light blue, chemokines and leukocyte recruitment; purple, microglia activation; dark blue, glia reactivity. Gene names are listed below the heat map. The colour bar on the right refers to the relative gene expression level scaled according to z-score standardization.
We evaluated the expression and distribution of the glial reactive markers GFAP and Iba1 in mouse eyes (Supplementary Fig. 17). Immunofluorescence analysis of retinal sections revealed no appreciable differences in GFAP or Iba1 staining intensity or pattern, suggesting that the NPs do not elicit a detectable inflammatory response in the retina. Further, RNA-sequencing on retinal samples from eyes injected with either NPs or PBS was conducted. Principal component analysis demonstrated overlapping clustering of the two groups, with no statistically significant separation (Fig. 6g). Likewise, analysis of gene expression patterns across relevant pathways, including photoreceptor and RGC health, cell death, microglia activation and glia reactivity, revealed no statistically significant differences between eyes treated with NPs or PBS (Fig. 6h). Consistent with the absence of changes in GFAP and Iba1 staining, differential expression analysis showed no significant differences in Gfap or Aif1 expression, respectively, between NP- and PBS-injected eyes (P = 1), indicating that the treatment did not induce glial activation. Notably, no expression of pro-inflammatory cytokines (Il1b, Tnf and Il6) or the inflammasome component (Nlrp3) were detected in any of the groups. The complete list of differentially expressed genes is provided in the Source data.
To further support the ocular safety profile, we investigated how NP exposure affected retinal cell viability, where NPs were found well tolerated by both R28 (rat retinal neuron cell line) and ARPE-19 (human adult retinal epithelium cell line) (Supplementary Fig. 18a,c). Across all timepoints, cell viability remained above approximately 70% within the tested concentration (0–150 µg cm−2). At 48 h of exposure, the 10% inhibitory concentration (IC10) values were 9.5 and 43.8 µg cm−2 for the ARPE-19 and R28 cells, respectively. Similarly, the LDH assay (Supplementary Fig. 18b,d) also confirmed no cytotoxicity by the hg-C3N4 NPs treatment at 2.0 µg cm−2 with 10 min of light treatment (10 mW cm−2, 1 Hz, 100-ms pulse width). Moreover, light-induced calcium modulation at the cellular level was confirmed on retinal ARPE-19 cells (Supplementary Fig. 19 and Supplementary Video 28).
Finally, to evaluate whether the intervention could restore light sensitivity in visually impaired mice (Fig. 7a–h), we administered the NPs into Pde6βrd10 mice intravitreally. These mice (hereafter rd10 mice) represent a translationally relevant mouse model of autosomal recessive retinitis pigmentosa and typically lose electroretinogram (ERG) responses, a standard measure of photoreceptor function, by ~8 weeks of age61. Both eyes of 12-week-old rd10 mice were injected with hg-C3N4 NPs (n = 7) or control particles (SiO2, n = 3; Red F, n = 4), with OCT and fundoscopic monitoring. Age-matched C57BL/6JRj WT mice (n = 6) served as healthy controls.
Fig. 7: hg-C3N4 NPs can mediate light responses in vivo and ex vivo.

a, Schemes of visual function experiments in rd10 and WT mice in vivo. REF, reference electrode. b, The schedule of experiments in rd10 mice. c, Analysis of dark preference in the LDB test. Statistical analysis was performed with one-way ANOVA and Tukey’s test for multiple comparisons. d,e, SNR analysis of VEP responses in rd10 mice, showing SiO2 control and hg-C3N4-treated eyes (d) and Red F control eyes (e). Eyes that reached the criteria as being responders are bolded (criteria: SNR positive ≥4.0 in ≥3 of 4 stimulus intensities, positive energy ratio ≥0.6, peak latency between 80 and 220 ms, template r ≥ 0.4). f, The fraction of eyes classified as VEP responders. The bars indicate the proportion of responder eyes with Wilson 95% CIs. The unit of analysis was the treated eye (one V1 hemisphere recording per stimulated eye). Pooled controls comprised SiO2- and Red F-injected rd10 mice. Each group contained n = 7 mice (14 treated eyes). In the hg-C3N4 group, 5 of 14 eyes from 4 of 7 mice met responder criteria (36%, 95% CI 17% to 59%), compared with 1 of 14 eyes from 1 of 7 mice in pooled controls (7%, 95% CI 1% to 31%). Risk difference +29% (95% CI −15% to 60%). g, VEP waveforms in response to 500 cd s m−2 stimulus. Thick lines represent group-mean VEP waveforms, whereas the thin lines represent responses from individual eyes. Note the different y-axis scale for WT and rd10 traces (WT, n = 10 eyes, N = 6 mice; rd10_SiO2, n = 6 eyes, N = 3 mice; rd10_Red F, n = 8 eyes, N = 4 mice; rd10_hg-C3N4, n = 14 eyes, N = 7 mice). h, Representative scotopic ERG waveforms from C57BL/6J WT and rd10 mice in response to a rod-saturating stimulus. WT mice show robust ERG responses, whereas rd10 mice display flat responses across all treatment groups. Note the different y-axis scale for WT and rd10 traces. i, A schematic of the ex vivo MEA retina recording set up. The inset illustrates RGCs interacting with hg-C3N4 NPs. j, Fluorescent image of porcine retinal flat mounts showing hg-C3N4 particle localization on the RGC layer. Scale bar, 10 μm. Blue, hg-C3N4; turquoise, Draq5; red, RbPMS. k,l, MEA traces (−50 to +100 ms around light onset) recorded before particle application, after hg-C3N4 addition and after TTX (k) and the firing frequency 100 ms following light stimulation (l). Representative traces were selected from stimulus 10 following 30 repeated light stimulations recorded at 1 Hz. Statistical analysis by a Kruskal–Wallis test with Dunn’s multiple comparisons. m, Peak-to-peak amplitudes from 31 MEA light dose–response recordings (100-ms light pulses). The asterisk denotes the control without hg-C3N4. Statistical analysis by a Kruskal–Wallis test with Dunn’s multiple comparisons. Illustrations in a created in BioRender; left, Leinonen, H. https://biorender.com/6mxnjad (2026); right, Leinonen, H. https://biorender.com/62x9jml (2026). Credit: i, Servier Medical Art under a Creative Commons license CC BY 4.0.
To assess whether hg-C3N4 treatment could restore visually guided behaviour, we tested the mice in a light–dark box (LDB) paradigm 4 weeks after intravitreal injection (Fig. 7a,b). Among the hg-C3N4-injected rd10 mice, three of seven spent more than 60% of the time in the dark compartment, a preference level comparable to that observed in three of six WT animals. By contrast, control rd10 mice injected with SiO2 or Red F NPs displayed no clear dark preference, consistent with a complete loss of light sensitivity (Fig. 7c).
To independently evaluate light responses in the visual cortex, we next recorded visual evoked potentials (VEPs) using skull screw electrodes placed over the primary visual cortices under urethane anaesthesia (Fig. 7d–g). rd10 mice injected with control NPs (SiO2 or Red F) generally lacked discernible VEPs; however, one Red F-injected eye met the predefined responder criteria (Fig. 7d,e). By contrast, 5 of 14 eyes from hg-C3N4-treated rd10 mice exhibited reproducible VEP waveforms that met the objective responder definition (signal-to-noise ratio (SNR) ≥4, positive polarity 80–220 ms latency and ≥3 of 4 stimulus intensities passing). Some responses in hg-C3N4-treated eyes were clearly distinguishable from noise (Supplementary Fig. 20), albeit much smaller and slower than those in WT mice.
Quantitatively, the fraction of VEP-responding eyes in the treated group was 36% (95% confidence interval (CI) 17% to 59%), compared with 7% (95% CI 1% to 31%) in the combined control group, as estimated using Wilson binomial CIs (Fig. 7f). The corresponding risk difference between groups was +29% (95% CI −15% to 60%), indicating a numerically higher probability of measurable cortical light responses in the hg-C3N4-treated group, although the CI included zero. These data, together with the independently assessed LDB behaviour, indicate that a subset of treated rd10 mice recovered both behavioural and cortical sensitivity to light. Notably, the three hg-C3N4-treated mice that showed dark preference in the LDB test also exhibited the highest VEP SNRs and were classified as electrophysiological responders, suggesting a convergent relationship between behavioural and cortical recovery.
To determine whether the behavioural and cortical light responses observed following hg-C3N4 treatment were mediated by restored photoreceptor function, we performed scotopic ERG recordings 1 month after injections under ketamine and medetomidine anaesthesia. No detectable ERG signals were observed in any of the injected rd10 mice, suggesting a lack of light sensitivity from the photoreceptors (Fig. 7h). Of note, the flash ERG response primarily arises from photoreceptor hyperpolarization (a-wave) followed by subsequent bipolar cell depolarization (b-wave); by contrast, RGC electrical activity is not detected due to similar amounts of ON and OFF pathway activation leading to signal cancellation62. Thus, the absence of ERG responses is consistent with the behavioural and cortical light responses arising downstream of classical photoreceptor-driven retinal signalling.
To explore potential retinal factors that might contribute to the observed variability, we examined the residual photoreceptor population. Postmortem histology (Supplementary Fig. 21) and M-opsin staining (Supplementary Fig. 22) revealed small remnants of M-cones in rd10 retinas. In all treatment groups, M-opsin was confined to the cell bodies rather than the outer segments, and both inner and outer segments were absent. Although classical phototransduction requires intact outer segments, recent studies have shown that cones lacking outer segments can retain light responsiveness63. Moreover, studies in rd10 mice indicate that residual cone-driven responses can persist until approximately P140 (20 weeks old), whereas by P238 (34 weeks old) this activity is lost64. Thus, a minimal degree of cone-mediated sensitivity cannot be completely excluded in our rd10 mice that underwent VEP recording at 26–27 weeks of age. However, because the extent of cone remnant preservation and M-opsin mislocalization was comparable across all treated and control groups (Supplementary Figs. 21 and 22), residual cones alone are unlikely to account for the pattern of VEP and LDB outcomes observed across groups. Taken together, these in vivo findings highlight both the potential and the limitations of hg-C3N4-mediated vision restoration in the rd10 mouse model, motivating evaluation of retinal light sensitivity under conditions where delivery constraints are minimized and retinal access is fully controlled.
To further directly monitor RGC spiking activity in response to controlled optical stimulation, ex vivo porcine retinal tissue was placed photoreceptor-side down on a multielectrode array (MEA), with the RGCs facing upwards (Fig. 7i,j). Applying 1-ms visible-light LED pulses (450 nm), we first recorded baseline light-evoked potentials, which elicited a low firing rate of 5 Hz across all channels (Fig. 7k,l and Supplementary Fig. 23) accompanied by small mean peak-to-peak amplitudes (mean 12.0 µV; Supplementary Fig. 26). Following application of hg-C3N4 NPs to the same tissue and their settlement onto the RGC layer (Fig. 7j), illuminating with the same light dose (30 mW cm−2) resulted in a pronounced increase in RGC spiking activity, with the mean firing rate increasing from 5 to 29 Hz, determined over the 1–100-ms window following light onset (Fig. 7k,l and Supplementary Fig. 24). In parallel, peak-to-peak amplitudes also increased from 12.0 µV to 39.1 µV (Supplementary Fig. 26), consistent with enhanced activation of RGCs in contact with hg-C3N4. In the presence of tetrodotoxin (TTX), both the firing rate and peak-to-peak amplitude of light-evoked responses were greatly reduced (1.3 Hz and 12.1 µV, respectively) (Fig. 7k,l and Supplementary Figs. 25 and 26), confirming that the recorded activity indeed arises from action potential firing in RGCs65. A light-dose dependence of the MEA shows that light intensities as low as 8.9 mW cm−2 were sufficient to produce measurable RGC activity (Fig. 7m).
Discussion
Tools to probe intracellular and intercellular electrophysiological mechanisms are crucial for studying physiological and pathological pathways, not only prevailing in cardiovascular and neurodegenerative diseases. For instance, a recently discovered hub of highly connected glioma cells, similar to heart ‘pacemaker’ cells, has been shown to drive calcium propagation through tumour microtube networks and promote expansion of the lethal malignant glioma66. At present, these studies are often hampered by the available disruptive methods67. We present the hg-C3N4 as organic semiconductor NPs that enable injectable, non-invasive and leadless modulation of cell signalling across a broad spectrum of excitable and non-excitable cell types. The photoresponse mechanism of hg-C3N4 NPs has been revealed to be of both anodic faradaic and photothermal nature. The anodic currents, which lead predominantly to oxidative reactions, and the photothermal effects both contribute to the generation of H2O2 (ref. 68). While interfacial reactions are complex and additional pathways for ROS generation may exist69, ROS such as H2O2 are important signalling molecules involved in many fundamental physiological processes70, including interactions with neuronal ion channels71,72. Although physiological ROS levels are tightly regulated around 1–5 µM and elevated concentrations can be cytotoxic70,73, neither cytotoxic effects (Supplementary Figs. 5, 6 and 18) nor inflammation induction in vivo74 (Fig. 6g,h and Supplementary Fig. 17) were observed in this study.
The mechanism behind the observed intracellular calcium transient is attributed to hg-C3N4 NPs interacting with calcium-storing organelle ER75 (Figs. 1b and 4a). As we showed that the photofaradaic and photothermal effects are accompanied by ROS production (Fig. 2 and Supplementary Fig. 2), the generated ROS activates intracellular RyRs (Supplementary Fig. 10), leading to ER calcium release. In excitable cells, the process is independent of IP3R signalling, extracellular calcium influx, TRP channels and thermal effects, reinforcing that intracellular ROS-triggered ER calcium release is the central mechanism of stimulation in excitable cells68,76.
The hg-C3N4 NPs could be safely internalized, an important feature for intracellular stimulation. Combined with the clear directedness (Fig. 3f), as well as the clustering of particles around the nucleus (Fig. 3e and Supplementary Fig. 4c), the inhibitor assay indicates that the particles may internalize through multiple pathways, including both phagocytosis- and endocytosis-driven mechanisms44,77 (Fig. 3g), and are actively trafficked in endosomal compartments towards the perinuclear region45,78.
The hg-C3N4 NPs endow intercellular signal propagation by applying laser stimulation with subcellular resolution (Fig. 4). Collectively, these results demonstrate that hg-C3N4 NPs enable pacing of the CM network’s synchronous beating, using simple LED stimulation (Fig. 5). The intercellular propagation of these signals is facilitated by gap-junction coupling (Supplementary Fig. 15), a hallmark feature of cardiac tissue that ensures coordinated contraction. Future application of optical-fibre-coupled endoscopes22 could further enable in vivo heart pacing and clinical translation.
Compared with silicon nanowires, a widely explored optoelectronic interface79, hg-C3N4 generate anodic rather than cathodic faradaic photocurrents and exhibit high chemical stability16 (Supplementary Figs. 1b and 16), representing a unique advantage to silicon nanowires, which have been shown to gradually degrade under physiological conditions79. Consistent with this, the photocurrent generated by hg-C3N4-coated substrates remained stable under repeated 473-nm laser pulses across multiple on–off cycles. (Supplementary Video 13). Together, these intrinsic properties support the feasibility of hg-C3N4 for repeated and long-term use in biological environments.
Photostimulation is a concept worthy of further development to achieve high spatiotemporal resolution. Importantly, using an NP dose that caused no changes in the retinal gene expression profile (Fig. 6h) and maintained 93 % viability in R28 cells, we achieved a partial restoration of light responsiveness in rd10 mouse retinas, demonstrating safe in vivo delivery and therapeutic benefit without detectable cytotoxicity.
However, in rd10 mouse experiments, relatively high luminance levels were required to elicit detectable light responses in the visual cortex. This limited sensitivity may reflect the limited efficiency of intravitreal delivery in bringing NPs into sufficient contact with RGCs. To further optimize this vision restoration strategy, alternative delivery methods, such as subretinal injection and cell-specific targeting should be explored. These approaches may facilitate NP integration with bipolar cells, enabling signal amplification and more natural retinal processing compared with direct RGC targeting80. Finally, although the low tissue penetration depth of blue light might limit the use of hg-C3N4 NPs, red shifting the absorbance of g-C3N4 towards near infrared has been proven to be feasible81. In addition, given that focused ultrasound has been utilized to generate ROS for vinyl monomer polymerization82, the emerging piezoelectric properties of g-C3N4 (ref. 83) could potentially expand the applicability of hg-C3N4 NPs for deep tissue stimulation.
This study establishes biomimetic hg‑C3N4 NPs as a platform capable of photomodulating biological activity across a broad multiscale hierarchy, spanning subcellular, intercellular and tissue levels.
Methods
Silica template synthesis
The silica template was synthesized according to the classical Stöber method24. In detail, the mixed solution containing 4.0 ml of aqueous ammonia (28 wt%), 74.0 ml of ethanol and 10.0 ml of deionized water were stirred vigorously at 30 °C for 1 h. Then, 5.6 ml of tetraethoxysilane (TEOS) was slowly added to the above mixture under continuous stirring and stood still for 1 h to yield uniform monodisperse silica cores. Next, 3.56 ml of TEOS and 1.71 ml of n-octadecyltrimethoxysilane (C18TMOS) were added dropwise to the above solution while stirring. After the solution was dropped, the mixture was continuously stirred for 15 min to form a thin silica shell around the dense silica core. Subsequently, the mixed solution was allowed to stand for 3 h to promote the cohydrolysis and condensation of the TEOS and C18TMOS. The mixed solution was centrifuged at 13,000g, washed in deionized water and ethanol, dried at 80 °C and calcined at 550 °C for 6 h in air. Finally, the obtained silica template was neutralized with a 1 M HCl solution and dried at 80 °C overnight.
hg-C3N4 NP synthesis
A solution of 1.0 g of the silica template and 5.0 ml of cyanamide aqueous solution (50 wt%) was mixed for 30 min in a flask, then the mixture was ultrasonicated in vacuum at 60 °C for 3 h and stirred at 60 °C overnight. After centrifugation and drying, the products were transferred to a chemical vapour deposition furnace for calcination and heated to 550 °C under flowing N2 for 4 h with a heating rate of 4.4 °C min−1. The obtained products were treated with 4 M NH4HF2 for 12 h to remove the silica template. In the last, the yellow powders were centrifuged at 13,000g, washed three times in deionized water and once in ethanol and then dried in vacuum at 60 °C for 10 h to obtain the final HCNS products.
Electron microscopy
The particle morphology was analysed by SEM (TM3030Plus, tabletop microscope, HITACHI). TEM (Tecnai G2 Spirit) was used to visualize the hollow-sphere structure. TEM copper grids (Merck) were employed for analysis with an acceleration voltage of 120 kV. TEM with energy-dispersive X-ray spectroscopy (TEM-EDX) was performed using a JED-2300 F200 microscope operated at an accelerating voltage of 200 kV. Samples were dispersed in ethanol, then drop cast onto 300-mesh copper grids coated with amorphous carbon film dried at room temperature before measurements.
Biodegradation characterization
The sample was dispersed into PBS buffers (pH 4.5 and 7.0) and drop cast onto the conductive tape at days 0, 7, 14 and 30. After drying at room temperature, the samples were sputter-coated with 10-nm Au layer for SEM characterization.
DLS
The hydrodynamic size distribution of NPs was measured by DLS using a Malvern Zetasizer Nano ZS. Samples were dispersed in filtered PBS buffer (pH 7.4), diluted to 0.05 mg ml−1 in filtered PBS buffer and DMEM with 10% FBS and equilibrated at 25 °C for 3 min before measurement. The intensity-weighted size distribution was derived from the average of three to five runs. Zeta potential was measured using the same instrument for five to eight runs.
UV–vis spectroscopy
UV–vis spectra were acquired with the GENESYS 150 UV–Visible spectrophotometer (Thermo Fisher Scientific).
XRD
XRD measurements were performed using a SmartLab 9 kw X-ray diffractometer (Cu K ɑ radiation) operated at 60 kV and 220 mA. The data were collected in the 2θ range of 5°–60° with a scanning step of 0.02° and a scan speed of 20° min−1. The samples were ground into fine powders and pressed onto a glass slide for measurement.
XPS
XPS measurements were carried out on a Thermo Scientific ESCALAB Xi+ XPS spectrometer with Al K ɑ radiations, and with the C 1s peak at 284.8 eV as an internal standard for all the spectra. The XPS spectra peak deconvolution was performed with Avantage software using a Shirley background.
Photocurrent measurement
A detailed protocol on how to acquire photocurrent data has been described previously29. Photocurrents and photothermal effects were quantified using a patch-clamp set up and a 20×/0.5 NA water-immersion objective for optical excitation. Illumination was provided by a 625-nm LED (M625L4-C1, Thorlabs) or a 365-nm LED (M365L3-C1, Thorlabs) with a ~750-µm spot size. The 365- and 625-nm wavelengths were selected for mechanistic photocurrent characterization to probe the wavelength-dependent photoelectrochemical and photothermal responses of hg-C3N4, whereas wavelengths optimized for the respective experimental configurations were used for subsequent cellular and tissue photostimulation. Light pulses were TTL-triggered via a Digidata 1550 digitizer (Molecular Devices). Glass micropipettes (~2–4 MΩ, pulled with a P-97 puller, Sutter Instrument), filled with 1× PBS, were positioned <10 µm above the photoactive material immersed in the same PBS solution. The sample as well as the objective was immersed in PBS. An upright microscope (Olympus, BX61WI) was used to illuminate the sample with LED light, with a pulse duration of 10 or 100 ms. An AxoPatch 200B amplifier (Molecular devices), Digidata 1550 digitizer (Molecular devices) and Clampex software (Molecular devices), were used together to conduct the measurement and control the light source. The photothermal response was determined by plotting the light-induced current change (ΔI_light) against the pipette holding current (I0) and extracting the slope. The local temperature increase was estimated by calibrating pipette resistance changes in pre-heated PBS solutions (20–50 °C), using a thermocouple placed near the pipette tip to establish a resistance–temperature calibration curve.
H2O2 quantification
H2O2 production was evaluated using different concentrations of particles in PBS (0, 1, 2 and 5 µg cm−2). The solutions were added to 24-well plates and particles were allowed to settle for 2 h before being irradiated with 450-nm LED light (75 mW cm−2) and pulsed for 100 ms duration and 1 Hz frequency for 30 min. Control groups were kept light protected under the same conditions. Subsequently, 3× 100 µl were transferred from each well to a black 96-well plate. The aliquots were stained with 91 µl of a solution containing horseradish peroxidase (HRP; 4,250 units l−1, Thermo Fisher) and p-hydroxyphenyl acid (pOHPAA; 1.0 × 10⁻³ M, Sigma) in 0.25 M Tris buffer (Sigma). Standards with known H2O2 concentrations were treated in the same way. Fluorescence intensity was measured with an excitation of 320 nm and an emission of 405 nm using a microplate reader (CLARIOstar Plus Microplate Reader).
ESR
The generation of ROS was assessed using ESR spectroscopy (Bruker Magnettech, ESR5000). Spin traps were used to detect specific species: TEMP (100 mM in H2O) for singlet oxygen (1O2), DMPO (100 mM in methanol) for superoxide (•O2−) and DMPO (100 mM in water) for hydroxyl radicals (•OH). NPs (hg-C3N4) were dispersed at 1 mg ml−1 in either deionized water or methanol using probe sonication. Each dispersion was mixed 1:1 with the relevant spin trap and loaded into sealed glass capillaries. Samples were illuminated using an LED light source (450 nm, 75 mW cm−2) for 0, 5 and 10 min. ESR spectra were recorded immediately after using the following parameters: magnetic field range (B) of 330.0–340.0 mT, centre field (B0) of 335.0 mT, sweep width of 10 mT, sweep time of 30 s, modulation of 0.2 mT and modulation frequency of 100 kHz.
Cell line culture
NIH/3T3 mouse fibroblasts (ATCC, CRL-1658), R28 rat retinal precursor cells (Kerafast), ARPE-19 human retinal pigment epithelial cells (ATCC, CRL- 2302) and HeLa human cervical cancer cells (ATCC, CCL2) were cultured in DMEM supplemented with 10% FBS, 1% penicillin–streptomycin (P/S) and 4 mM L-glutamine. All cells were kept at 37 °C and 5% CO2 and media were changed every second day.
HL-1 murine cardiac muscle cells (Merck, SCC065) were cultured according to the manufacturer’s protocol. Before seeding, the flasks and wells were precoated with a gelatin/fibronectin solution (EMD Millipore, ES-006; Sigma, F-1141) for at least 2 h. HL-1 cells were cultured in Claycomb Basal Medium (Sigma, 51800C) supplemented with 10% HL-1 qualified FBS (EMD Millipore, TMS-016-B), 2 mM Glutamax (Thermo Fisher), 0.1 mM norepinephrine (Sigma, A0937) and 1% P/S. The cells were kept at 37 °C in a humidified 5% CO2 atmosphere and the culture medium was changed daily.
Cardiac cell culture
Primary CMs and CFs were isolated and collected from P0–5 neonatal rats following the literature75 and reagents were obtained from Pierce primary CM isolation kit (Thermo Fisher Scientific)84. In short, heart tissue was excised into ice-cold HBSS medium without Ca2+ or Mg2+ and digested with reconstituted papain and thermolysin enzymes. Isolated CFs/CMs hybrid cells were washed with HBSS, seeded onto fibronectin (Sigma)-coated glass-bottom imaging dishes and cultured in high-glucose DMEM supplemented with 10% FBS, 1% P/S and 1% GlutaMAX. Animal procedures were approved by the University of Chicago Institutional Animal Care and Use Committee (IACUC) and conducted in complete compliance with the IACUC Animal Care and Use Protocol.
iPS cell-CM culture
iPS cell-CMs were kindly provided from Prof. Manuel Maria Mazo Vega from Cima Universidad de Navarra. Cells were seeded at a density of 250,000 cells cm−2 in seeding medium consisting of RPMI 1640 (Sigma, R8758), 10% KnockOut Serum Replacement (Gibco, 10828010), 2% B27 supplement (Thermo Fisher Scientific, 17504044), 1% P/S and 10 µM Y-27632 ROCK inhibitor. Cells were plated in 24-well plates precoated with Matrigel (Corning, 354230). The following day, the medium was changed to maintenance medium composed of RPMI 1640, 2% B27, and 1% P/S. Cells were cultured at 37 °C in a humidified 5% CO2 incubator, and the medium was refreshed every 2–3 days.
Particle co-culture
Before in vitro experiments, hg-C3N4 NPs were dispersed in PBS at 1 mg ml−1 by probe sonication (MS73, 60% amplitude, 1 s on/off, 3× 5 min). For sterilization, NPs were either autoclaved, sonicated in ethanol followed by washing and resuspension in PBS, or exposed to UV light for 15 min. Unless stated otherwise, hg-C3N4 NPs were added to cell cultures at a surface dose of approximately 2.0 µg cm−2 hg-C3N4.
DCFH-DA assay
To assess intracellular ROS production, a DCFH-DA assay (Abcam, ab113851) was performed following the manufacturer’s protocol. NIH/3T3 cells were seeded in 96-well plates at a density of 20,000 cells per well and incubated overnight to allow cell attachment. hg-C3N4 NPs were added 8 h before the assay at a concentration of 2.0 µg cm−2. Cells were then subjected to continuous blue-light stimulation (450 nm, 10 mW cm−2) for 10 min using an LED array.
Immediately following stimulation, 20 µM DCFH-DA working solution was added to each well, and the cells were incubated for 45 min at 37 °C in the dark. After incubation, the dye solution was aspirated and the wells were washed twice with warm PBS. Fluorescence was first assessed qualitatively using a green fluorescence filter on the EVOS M7000 microscope. Quantitative measurements were then performed 4 h post-staining using a microplate reader (excitation, 485 nm; emission, 535 nm). Four experimental groups were evaluated (with and without NPs and with and without light), each in quadruplicates.
LDH cytotoxicity assay
Cytotoxicity was evaluated using a LDH assay kit (Roche) following the manufacturer’s instructions. NIH/3T3 cells were seeded at 2,500 cells per well, ARPE-19 and R28 cells at 5,000 cells per well, and iPS cell-CMs at 80,000 cells per well, all in 96-well plates and in sextuplicates. For NIH/3T3 cells, two experimental groups were assessed: with and without NPs. For ARPE-19, R28, and iPS cell-CMs, two additional groups were added: with and without light exposure. Where applicable, hg-C3N4 NPs were added at a concentration of 2.0 µg cm−2. Light stimulation was performed using a blue LED array (10 mW cm−2, 1 Hz, 100-ms pulse width) for 10 min.
Two hours after light stimulation, 80 µl of the cell culture medium was collected and centrifuged at 300×g for 5 min at 4 °C. The activity levels of LDH were then measured by transferring 50 µl of the supernatant to a new 96-well plate and adding reaction mix containing catalyst and dye in a 1:1 ratio. Subsequently, the plate was incubated in the dark at room temperature for 30 min, followed by analysis of absorbance on a Victor Multilabel Reader (PerkinElmer) at 490 nm. To establish the toxicity levels, the LDH activity of cells cultured without particles was regarded as the low toxicity control, while that of cells treated with 1% Triton X100 was marked as high-toxicity control. The relative toxicity levels were calculated using the following equation:
Live/dead staining
Cell viability upon exposure to particles and light was assessed using live/dead staining using NIH/3T3 cells cultured for 24 h. The particles (2.0 µg cm−2) were introduced 6 h before the light stimulation. The staining solution, a combination of 1:1,000 calcein-AM (green dye) and 1:500 propidium iodide (red dye) in serum-free medium, was added after aspiration of the culture medium and a single rinse with serum-free medium. After adding the staining solution, cells were then incubated for 30 min at 37 °C. Afterward, the staining solution was discarded, wells were rinsed with PBS and cells were examined using a fluorescent microscope (Invitrogen, EVOS M7000).
To evaluate long-term cytocompatibility under repeated stimulation, live/dead staining was additionally performed on ARPE-19 cells, R28 cells and iPS cell-CMs after 7 days of culture with twice-daily blue-light stimulation (10 mW cm−2, 1 Hz, 100-ms pulse width, 10 min).
CCK-8 proliferation assay
The effect of particles on cell proliferation was assessed using a Cell Counting Kit-8 (CCK-8, Dojindo). Five thousand NIH/3T3 cells were seeded in 96-well plates in sextuplicate. Then, 2.0 µg cm−2 of hg-C3N4 particles were added. The CCK-8 assay was performed on days 1, 3 and 8 following the manufacturer’s protocol. In brief, the culture medium in each well was replaced with CCK-8 solution diluted 1:20 in medium. The cells were then incubated for 2 h, after which the medium was transferred to a new 96-well plate and fresh culture medium was replenished. Subsequently, the absorbance at 450 nm was analysed on Victor Multilabel Reader (PerkinElmer). The proliferation index is calculated as
with Ab being the absorbance value of the CCK-8 assay measured on day x (x = 1, 3, 8).
MTT assay
ARPE-19 cells were seeded in a transparent 96-well plate, grown to confluency and serum starved. R28 cells were serum starved and seeded at a density of 25.000 cells per well in a transparent 96-well plate. The next day, the cells were incubated with 5, 25, 50, 100 or 150 µg cm−2 of hg-C3N4 NPs. Untreated cells (no NPs) served as the 100% reference for per cent-of-control calculations. At 48 h after treatment with hg-C3N4 NPs, an MTT assay was conducted using the MTT cell proliferation assay kit (Cayman Chemical) following the manufacturer’s instructions. Absorbance was measured at 570 nm using a SpectraMax iD3 absorbance reader (Molecular Devices). IC10 values were obtained directly from the curves by interpolating the concentration at which cell viability reached 90%. Each treatment condition was tested in quintuplicates, and viability values represent the mean ( ± s.d.) of individual measurements relative to control (no NPs).
hg-C3N4 NP internalization
For live-cell imaging and single-particle tracking of NIH/3T3 and R28 cells, an inverted spinning-disk confocal microscope (Olympus SpinSR10) was applied. The spinning-disk confocal microscope used an oil immersion 60× objective (Olympus) for recording images and videos with a total pixel width of 183 nm, a numerical aperture of 1.4 and a CMOS camera (photometrics PRIME 95B). An excitation wavelength of 640 nm was used to excite the CellMask DeepRed plasma membrane stain (Invitrogen, C10046) at 2% laser power and 100 ms exposure time, while hg-C3N4 NPs were excited with a 488-nm laser at laser power at 25%, 100-ms exposure time for 100 frames (frame rate of 102 ms) with a gain of 2.
Then, 7,000 NIH/3T3 or 10,000 R28 cells per well were added with the appropriate amount of growth media and left for incubation at 37 °C, 5% CO2 the day before imaging on IbiTreat microscope plates. On the day of microscopy, the 100 µl growth media was replaced with 100 µl test solution of hg-C3N4 NP dispersion for a final concentration of 0.6 µg cm−2 and incubated for 1, 4, 8 or 24 h at 37 °C and 5% CO2. The test solution was then removed and replaced with pre-heated 200 µl 1× CellMask DeepRed plasma membrane stain and incubated for 5 min, before the wells were washed once with imaging media, followed by replacing with fresh imaging media for data acquisition. The inhibition study was performed similarly, but before addition of the of hg-C3N4 NP test solution, the cells were incubated with the given inhibitors for 1 h (500 µM amiloride (Thermo Scientific, 15414599), 1 µM bafilomycin (MedChemExpress, HY-100558), 100 µM chloroquine (Sigma-Aldrich, C6628), 80 µM dynasore (Sigma-Aldrich, D7693), 10 µg ml−1 nystatin (Gibcol, 11548886) or DMEM + 10% FBS for the control). Subsequently, 0.6 µg cm−2 hg-C3N4 NP dispersion was added for 3 h in the presence of the inhibitors. Finally, the test solution was removed and replaced with pre-heated 200 µl 1× CellMask DeepRed plasma membrane stain and incubated for 5 min, before replacing with imaging media for data acquisition. For detection and single-particle tracking, the Trackpy85 package in Python based on the Crocker–Grier algorithm86 with an in-house modification from the Hatzakis lab was used with an initial SNR threshold between 0.3 and 1.0 based on manual inspection for each field of view and a postprocessing local SNR threshold of 0.3 kept constant for all conditions. Cells were segmented using CellPose87 and then particles were assigned to the cell masks to quantify particle internalization per cell. For investigating the directedness, a 0.5 mg ml−1 hg-C3N4 NP stock was prepared in PBS by sonication for 15 min. The stock dispersion was diluted in media and added to the cells to achieve a final particle concentration of 0.6 µg cm−2. The internalization videos were recorded using the Nikon TI2-E inverted microscope and NIH/3T3 fibroblasts. Particle tracking of internalized particles was done using the Manual Tracking plugin in ImageJ. Three-dimensional (3D) imaging of internalized hg-C3N4 NP colocalized with lysosomes in NIH/3T3 cells was performed on a Zeiss Lattice Light Sheet 7. Then 0.6 µg cm−2 hg-C3N4 NP were incubated with the cells for 21 h, after which LysoTracker DeepRed (1:20,000 dilution) was added to the cells and incubated for 3 h. Dual imaging of LysoTracker DeepRed (excited with 640-nm laser, laser power 1%) and hg-C3N4 NPs (excited with a 488-nm laser at laser power at 5%) was performed with a 30× 1,000 light-sheet and 50 ms exposure time in 539 slices (107.6 µm). The image was deskewed, deconvolved and displayed in Zeiss Zen software.
Particle tracking
The ONI Nanoimager was employed for single-particle tracking in cell-free media to investigate stokes diameter and diffusion coefficient. The maximal frame gap was set to 5, the maximal distance between frames was 0.7 µm and the minimum number of steps was set to 20. For particle tracking of internalized particles in 3T3 cells, the Manual Tracking plugin for ImageJ was used. Based on the tracking data acquired with the Manual Tracking plugin, the directedness was calculated as a parameter for directional movement. The angle θ was defined as the angle between particle movement direction and the direction of the centre of an individual cell. The directedness is defined as the cosine of this angle. If particle movement is directed exactly towards the centre of the cell the value is 1, whereas a value of 0 indicates perpendicular movement and −1 is movement in the opposite direction. The average directedness was calculated as Σcos(θ)i/n, where θ is the angle between the individual movement directionality vector and the directionality vector towards the centre of the cell relative to the particle position (n = 8)40.
Calcium imaging and laser stimulation
To visualize intracellular calcium, Cal-520 AM (ab171868, abcam) at 4 µM was used. After incubating the cells with dye in glass-bottom dishes at 37 °C for 30 min, the cells were rinsed and incubated for another 30 min at 37 °C in medium. The cells were observed with a 60× oil immersion objective using a Nikon TI2-E inverted microscope. Laser (473 nm) power was calibrated using the PM100D optical power metre (ThorLabs) and S120C photodiode power sensor (ThorLabs).
Isochronal and vector maps were generated using the ImageJ plugin Spiky88. An online available macro was used to generate ΔF/F0 movies89. Calcium flux videos were quantified with ImageJ by defining regions of interest around cells and measuring mean grey values (F). As background value (F0), the mean grey value of a region of interest (ROI) without cells was defined. The mean fluorescence intensity normalized to the background was then calculated as ΔF/F0 for each individual frame.
Pharmacological experiments
To investigate the molecular pathways underlying calcium signalling, we conducted a series of pharmacological blocking experiments in neonatal rat CM co-cultured with hg-C3N4. Cells were first loaded with 4 µM Cal-520 AM for 30 min, followed by initial imaging in standard extracellular buffer as a baseline control. Subsequently, cells were treated with specific inhibitors or antioxidants as indicated below, and after a brief recovery period, laser stimulation (473-nm, 100-ms pulse) was applied to non-previously imaged cells.
The following pharmacological agents were employed to dissect the signalling pathway:
- NAC (500 µM, 1 h pretreatment) was used to scavenge intracellular ROS.
Ryanodine (25 µM, 10 min) was applied to inhibit ER ryanodine receptors (RyRs).
2-APB (200 µM, 10 min) served as an inhibitor of IP3_Rs receptors.
Ruthenium Red (10 µM, 10 min) was used to block thermosensitive TRP channels.
HL-1 pacing
HL-1 cells were cultured in 24-well plates at a seeding density of 100,000 cells per well. Upon reaching 90% confluency, particles were added at concentrations of 2.0 µg cm−2 followed by a 6-h settling period before initiating calcium imaging.
For calcium flux imaging, cells were stained with Fluo-4 AM (Invitrogen, F14201). Samples were rinsed with Hanks’ buffer (Sigma, H6648) supplemented with 0.1 mM norepinephrine (Sigma, A0937), 5 mM glutamax and 20 mM Hepes (Sigma, H0887). Subsequently, cells were incubated with 5 µM Fluo-4 AM diluted in the same buffer for 30 min at 37 °C, 5% CO2. After rinsing twice, the cells were incubated in the buffer for an additional 20 min. Following the aspiration of the buffer, supplemented Claycomb medium was added and used during imaging.
Stimulation was performed using light irradiation at an intensity of 10 mW cm−2, a frequency of 1 Hz and a pulse width of 100 ms. Calcium flux was monitored and recorded via a 10× objective on the EVOS microscope (EVOS m7000) equipped with an on-stage incubator (37 °C, 5% CO2). The fluorescence traces presented represent typical cell responses across at least six independent cells per condition.
iPS cell-CM pacing
iPS cell-CMs were cultured in 24-well plates precoated with Matrigel at a density of 250,000 cells cm−2. Upon forming a confluent monolayer, particles were added at a concentration of 2.0 µg cm−2, followed by an 8 h settling period before calcium imaging.
For calcium flux imaging, cells were stained with Fluo-4 AM (Invitrogen, F14201) for 30 min at 37 °C in Thyrode’s solution (in mM: NaCl 138, KCl 4, CaCl2 1.8, MgCl2 1, NaH2PO4 0.33, HEPES 10 and glucose 10; pH 7.4), containing 5 µM Fluo-4 AM. Cells were then rinsed twice and incubated in fresh Thyrode’s solution for an additional 20 min.
Light stimulation was applied at 30 mW cm−2, 1 Hz and 50-ms pulse width. Imaging was performed using an EVOS m7000 microscope with a 10× objective and on-stage incubator (37 °C, 5% CO2). All conditions were performed in triplicate (three independent wells per condition) and fluorescence traces represent typical single-cell responses from each replicate.
Pharmacological blockers
To investigate the mechanism of light-induced calcium wave propagation during synchronized stimulation, HL-1 cells were cultured with hg-C3N4 and stained with Fluo-4 AM as described above. Two pharmacological blockers were tested individually: apyrase (50 U ml−1) and CBX (200 µM). Blockers were dissolved in a modified HBSS buffer containing (in mM) 1.3 CaCl2, 0.5 MgCl2, 0.4 MgSO4, 5.3 KCl, 0.4 KH2PO4, 4.2 NaHCO3, 137.9 NaCl, 0.3 Na2HPO4, 5.56 D-glucose and 10 HEPES (adjusted to pH 7.4). Blockers were added to the cells 15 min before light stimulation.
Light stimulation was performed for 10 min using the same settings described above. Calcium dynamics were recorded before and during blocker treatment using a 10× objective on the EVOS M7000 microscope, equipped with an on-stage incubator (37 °C, 5% CO2). Fluorescence traces represent typical single-cell responses, with data collected from at least six independent cells per condition.
Calcium imaging and LED stimulation of ARPE-19 cells
To evaluate the ability of hg-C3N4 NPs to induce calcium signalling in retinal cells, human retinal pigment epithelium cells (ARPE-19) were used. Cells were seeded in 24-well plates at a density of 150,000 cells cm−2 and incubated overnight. The following day, hg-C3N4 NPs were added at a concentration of 2.0 µg cm−2. Approximately 12 h after NP addition, cells were stained with 50 µM Fluo-4 AM in modified HBSS buffer containing (in mM) 2 CaCl2, 1.2 MgCl2, 5 KCl, 0.44 KH2PO4, 4.2 NaHCO3, 137 NaCl, 5 D-glucose and 20 HEPES, with pH adjusted to 7.4. Cells were incubated with the dye for 40 min at 37 °C, followed by a wash and a 15-min quenching step in dye-free buffer.
Calcium transients were recorded using a live-cell fluorescence microscope (EVOS M7000), before, during and after blue-light stimulation (10 mW cm−2, 3 s) using an external LED source. Experiments were performed in triplicate across four conditions: with and without NPs and with and without light stimulation.
Experimental animals
Animal experiments were conducted according to the Council of Europe (Directive 2010/63/EU) and approved by the Danish Animal Inspectorate (authorization no. 2020-15-0201-00745) and by the Finnish Project Authorization Board (ESAVI/26320/2021, ESAVI-2024-0037754). For experiments conducted in Aarhus, 8-week-old C57BL/6JRj male mice were purchased from Janvier Labs. C57BL/6J mice (n = 3 females, n = 3 males) used at the University of Eastern Finland originated from the colony of the Lab Animal Center at the University of Eastern Finland. The original colony of the retinitis pigmentosa model B6.CXB1-Pde6brd10/J (RRID: IMSR_JAX:004297, referred to as rd10) mice were a kind gift of Dr. Thierry Leveillard (Sorbonne University) but had been bred as a homozygote line at for at least five generations. In total, 14 rd10 mice were used in this study (n = 5 females and n = 9 males, randomly divided between groups). Animals were maintained under 12-/12-h light/dark with free access to autoclaved tap water and standard chow. All procedures were conducted in accordance with the Directive 86/609/EEC for animal experiments, FELASA Guidelines and Recommendations, and the ARVO Statement for the Use of Animals in Ophthalmic and Vision Research.
For injections and eye imaging, mice were anaesthetized with an intraperitoneal injection of a mixture of ketamine and medetomidine hydrochloride (Ketador or Ketaminol Vet (60–100 mg kg−1, Richter Pharma AG or MSD Animal Health)) and Cepetor or Domitor Vet (0.5–1 mg kg−1; ScanVet Animal Health A/S or Orion pharma). Pupils were dilated with a drop of 1% tropicamide (Mydriacyl, Alcon Nordic A/S) or a mixture of metaoxedrin–tropicamide drops (Oftan Tropicamide, 5 mg ml−1, Oftan metaoxedrin 100 mg ml−1; Santen Oy; mixed in a 1:5 ratio for ERG/VEP recordings) and eyes lubricated with carbomer eye gel (Viscotears 2 mg ml−1, Alcon Nordic). Ketamine and medetomidin anaesthesia was reversed by atipamezole 0.5–1 mg kg−1 (Antisedan, Orion Pharma).
Intravitreal injections
Intravitreal injections were performed under an OPMI 1 FR PRO Surgical microscope (Zeiss) or Leica S9D Stereo microscope (Leica Microsystems). A 30 G disposable needle was used to puncture the sclera near the limbus, and a 33 G or a 34 G blunt-ended needle connected to a Hamilton syringe (Hamilton Company) was then inserted into the opening followed by injection of 1 µl hg-C3N4 NPs (1 mg ml−1), red fluorescent silica particles (sicastar-Red F, 40-00-101, Micromod), SiO2 (silica) particles or PBS buffer solution. In the study with rd10 mice, Red F and SiO2 particles were used as controls instead of PBS to more closely mimic the physicochemical nature of hg-C3N4 NPs. For the bioavailability and safety study, both eyes of three WT mice were injected with NP solution and one mouse with buffer solution. Seven rd10 mice received hg-C3N4 NPs, four mice Red F particles and three mice received SiO2 particles bilaterally.
Fundus imaging and OCT
Non-invasive fundus imaging was performed at baseline and 14 days following intravitreal injections in the safety study conducted in C57BL/6JRj mice using the Micron IV image-guided OCT 2 system (Phoenix Research Laboratories). Similar imaging was performed in rd10 mice immediately after the intravitreal injection, and again 1 month after. Cross-sectional OCT B-scans and full volume 3D scans (only in some rd10 mice) were acquired centred on the optic disc. The B-scan images were segmented manually after loading the OCT scans into InSight software (Phoenix Research Laboratories). The coordinates were exported as .csv files and loaded into R (version R-4.3.0). The measurements were recentred around the optic nerve and the distance from the outermost border was calculated. Measurements less than 100 µm and further than 600 µm from the optic disc centre were excluded. Mean total retinal thickness, mean NGI thickness (combined thickness of retinal nerve fibre layer, retinal ganglion cell layer and inner plexiform layer), mean combined thickness of the inner nuclear layer and outer plexiform layer and mean outer nuclear layer thickness were calculated for each eye.
Bulk RNA-sequencing library preparation and RNA-sequencing
Mice were intravitreally injected with 1 µl hg-C3N4 NPs (1 mg ml−1) or PBS. At 14 days post-injection, retinas were dissected from enucleated eyes (n = 5) and total RNA was purified from homogenized tissue using a mini hand-held homogenizer (Labdex) and the RNease total mini kit (Qiagen). Next, RNA was quantified and quality-checked before library preparation. Reverse transcription was performed using barcoded oligo(dT) primers to selectively capture polyadenylated mRNAs and introduce unique sample identifiers. RNA was mixed with barcoded oligo(dT) primers and dNTPs, followed by annealing at 65 °C. First-strand cDNA synthesis was carried out using Maxima H Minus Reverse Transcriptase in the presence of a template-switching oligo and PEG8000 to enhance strand-switching efficiency. The reverse transcription programme included a 90-min incubation at 42 °C followed by 10 cycles alternating between 50 °C and 42 °C, with a final inactivation at 85 °C.
The resulting barcoded first-strand cDNAs were pooled and purified with 0.6× SPRIselect beads. Purified products were subjected to full-length cDNA amplification using KAPA HiFi HotStart ReadyMix with forward and reverse primers complementary to the barcode adaptor sequences. The amplification programme comprised initial denaturation at 95 °C for 3 min, followed by 12 cycles of 98 °C for 20 s, 57 °C for 15 s and 72 °C for 2 min, with a final extension at 72 °C for 5 min. Amplified cDNA was size-selected and purified with 0.6× SPRIselect beads.
For library construction, amplified cDNA was processed using the Illumina-compatible library preparation workflow with library construction kit (10X Genomics). In brief, cDNA underwent fragmentation, end repair and A-tailing, followed by adaptor ligation with Illumina-compatible dual index. Libraries were then purified by double-sided size selection using SPRIselect beads. Final library concentrations were measured by the Qubit dsDNA HS assay, and quality was confirmed on an Agilent Bioanalyzer High Sensitivity DNA assay. Libraries were sequenced on an Illumina NovaSeqX plus platform.
Retinal sectioning and flat mounting
Following killing of the animals at day 14 post-injection, eyes were enucleated and fixed in 4% stabilized formaldehyde buffer (VWR) overnight at 4 °C. One eye from each animal was used for flat mounting: the anterior segment and lens were removed and the neuroretina was carefully peeled off the retinal pigment epithelium (RPE)/choroid and immersed in ice-cold PBS buffer before proceeding with immunostaining. The other eye was processed for paraffin embedding and sectioning at the Department of Pathology, Aarhus University Hospital.
Electroretinography
Overnight dark-adapted mice were anaesthetized under dim red-light observation with ketamine (60 mg kg−1) and medetomidine (0.4 mg kg−1). Electroretinography (ERG) recordings were performed as previously described90. Pupils were dilated with applications of mydriatic eye drops (Oftan Tropicamid, 5 mg ml−1, Oftan Metaoxedrin 100 mg ml−1; Santen Oy; mixed in a 1:5 ratio). Corneal protection and conductivity were ensured using a carbomer-based eye lubricant (Viscotears, Bausch & Lomb Nordic AB). Mice were maintained at 37 °C on a heating pad throughout the procedure. Scotopic ERG responses were recorded using a Diagnosys Espion E3 system (Espion E3 console, Diagnosys) with silver-wire corneal electrodes and subdermal reference in the snout and ground electrode in the lower back. Both eyes were stimulated simultaneously with monochromatic green light across 12 increasing intensity steps (0.00001 to 30 cd s m−2), with interstimulus intervals (ISIs) ranging from 1 to 60 s and 2–25 sweeps per step. Signals were sampled at 2 kHz and filtered (1–300 Hz). Only the response for the strongest flash (30 cd s m−2) was used for final analysis.
LDB test
The light-dark box (LDB) test contained a plastic chamber (44 × 18 × 21 cm) divided into two equal compartments by a divider, which had a small passage that allowed animals to move freely between the compartments. One compartment was brightly lit (~900 lux) with a lamp above the arena, whereas the other compartment was darkened (~5 lux) getting light mostly from the lit side through the passage. Two days before the experimental day, all animals were allowed to familiarize themselves to the test environment for 3 min. In the actual experiment, each animal was placed initially in the lit compartment and was allowed to freely move in the apparatus (between the chambers) for 5 min in a calm and silent environment. Animal behaviour was recorded using a digital camera positioned above the light zone. A researcher blinded to the treatments analysed the total time spent in the dark compartment.
Cortical VEP recordings and analysis
Carprofen (20 mg kg−1 subcutaneous, Rimadyl Vet 50 mg ml−1, Zoetis) was prophylactically administered as a pain killer. Mice were initially anaesthetized with isoflurane in an induction chamber (concentration of 4.5%) and then transferred to stereotaxic frame (Kopf Instruments) where isoflurane was administered through a nose mask. At this point, urethane anaesthesia (2 g kg−1, subcutaneous) was also administered and the pupils were dilated with a mixture of metaoxedrin–tropicamide drops (5 mg ml−1 and 100 mg ml−1, respectively, mixed in a 1:5 ratio). During surgical procedures, isoflurane concentration was gradually lowered from 1.5% to 0.6% until finally stopped (leaving the animal to be anaesthetized with urethane only) when surgical operations were finalized. The surgery was performed as previously described91. The skin over the scalp was locally anaesthetized with lidocaine (20 mg ml−1, Xylocaine, Aspen Pharma Trading). Then, the scalp was opened with an incision and the skull was cleaned. Holes for electrodes were drilled with a dental drill leaving the dura mater intact. Two stainless steel mini screws (shank diameter 1 mm) were attached on the holes that were drilled bilaterally above the binocular primary visual cortex (medial/lateral: ±3 mm from lambda), and one on frontal bone (AP: 2 mm; ML: 1 mm) which served as the reference electrodes. The VEPs were recorded with a Diagnosys Celeris rodent ERG device (Diagnosys). The eyes were stimulated one at a time with an ascending (log unit intervals) stimulus intensity series as follows: step 1, a 4 ms flash at 0.05 cd s m−2 was delivered with 50–100 repetitions (the number of flash repetitions varied depending on the background EEG signal strength and waveform) and a 1-s ISI. Step 2 used a stimulus intensity of 0.5 cd s m−2, repeated 40–80 times with a 1.5-s ISI. In step 3, the intensity was increased to 5.0 cd s m−2, with 100–200 repetitions and a 5-s ISI. Step 4 involved stimulation at 50 cd s m−2, repeated 80–160 times with a 7.5-s ISI. Finally, step 5 used the highest intensity of 500 cd s m−2, with 40–120 repetitions and a 7.5-s ISI. Sweeps were manually inspected offline and consistent and clean sweeps averaged for waveform analysis. The EEG signal was collected at 2 kHz and bandpass-filtered between 0.25 and 300 Hz.
To enable unbiased identification of eyes exhibiting cortical VEP responses, we implemented an objective responder classification pipeline based on four quantitative waveform features. For each stimulus intensity, VEP responses were evaluated within a post-stimulus window of 80–220 ms, using the −50 to 0 ms interval as baseline. A response was considered ‘responder-like’ if it satisfied at least three of the following four criteria: (1) positive-polarity SNR ≥4, computed as the maximum positive deflection relative to the baseline standard deviation; (2) positive-energy ratio ≥0.6, defined as the proportion of signal energy above baseline within 80–220 ms; (3) peak latency between 80 and 220 ms after stimulus onset; and (4) waveform template correlation (Pearson r ≥ 0.4), where for each intensity a template VEP waveform was generated as the leave-one-out average of all other eyes recorded at the same intensity. This approach avoids bias towards any treatment group and provides an intensity-specific representation of VEP shape against which each candidate waveform is compared. The analysis was implemented over four stimulus intensities (0.5, 5, 50 and 500 cd s m−2). Eyes were classified as VEP responders if three or more intensities met the responder-like criteria. Responder fractions were quantified for each treatment group, and Wilson binomial 95% CIs were computed. Differences in responder probability between groups were expressed as risk differences with Newcombe 95% CIs. All waveform processing, responder classification and statistical computations were performed in Python
Immunostaining of retinal flat mounts and sections
Porcine retinas were fixed for 6 h at room temperature in 4% stabilized formaldehyde buffer (VWR), washed three times in PBS and blocked and permeabilized overnight at 4 °C in retina blocking buffer (RBB) containing PBS with 1% BSA (VWR) and 0.5% Triton X100 (Sigma). Next, retinas were incubated with rabbit anti-RbPMS (RNA-binding protein with multiple splicing, RGC marker) (1.6 mg ml−1; NBP2-20112, Novus Biologicals) diluted 1:500 for 48 h at 4 °C. Following a wash in wash buffer (PBS with 0.5% Triton X100) they were incubated with Alexa-568 Donkey anti-rabbit (2 mg ml−1; A10042, Thermo Fisher Scientific) diluted 1:400 overnight at 4 °C. Retinas were then washed and counterstained with Draq5 (5 mM; 62251, Thermo Fisher Scientific) diluted 1:1,000 in PBS for 10 min. Finally, retinas were washed and transferred to glass slides where they were mounted with the RGC layer facing upwards using Fluoromount-G mounting medium (Thermo Fisher Scientific).
Mouse flat mounts were blocked and permeabilized overnight at 4 °C in RBB before being incubated with rabbit anti-RbPMS (1.6 mg ml−1; NBP2-20112, Novus Biologicals) diluted 1:400 in RBB overnight at 4 °C. Next, the retinas were washed and incubated with Alexa-568 goat anti-rabbit (2 mg ml−1; A11011, Thermo Fisher Scientific) diluted 1:400 in RBB overnight at 4 °C. The flat mounts were washed and counterstained with Draq5 (5 mM; 62251, Thermo Fisher Scientific) diluted 1:1,000 in wash buffer before they were transferred to glass slides and mounted with the RGC layer facing upwards using Fluoromount-G mounting medium (Thermo Fisher Scientific).
Mouse retinal sections were deparaffinized in xylene overnight before rehydration with graded ethanol washes. Heat-induced epitope retrieval was performed in citrate buffer at pH 6 for RbPMS and Tris–EDTA buffer (10 mM Tris and 1 mM EDTA, Sigma) pH 9 for Iba1. Antigen retrieval was performed with proteinase K (20 µg ml−1 in PBS; Promega) for GFAP. Sections were blocked with 3% BSA and 1% Triton X100 in PBS for 1 h before incubation with anti-RbPMS (1 mg ml−1; NBP2-20112, Novus Biologicals) diluted 1:400, anti-GFAP (3.2 mg ml−1; Z0334, Dako) diluted 1:500, or anti-Iba1 (0.5 mg ml−1; 019-19741, FUJIFILM Wako Pure Chemical Corporation) diluted 1: 700
in PBS with 1% BSA overnight at 4 °C. The next day, sections were washed and incubated with Alexa-488 goat anti-rabbit (2 mg ml−1; A11008, Thermo Fisher Scientific) diluted 1:400 in PBS with 1% BSA for 30 min. The sections were washed and counterstained with Draq5 (5 mM; 62251, Thermo Fisher Scientific) diluted 1:1,000 in PBS and mounted with Fluoromount-G mounting medium (Thermo Fisher Scientific) on glass slides.
For postmortem evaluation after ERG, LDB and VEP tests, mouse eyes were fixed overnight in Hartman´s fixative (H0290, Sigma-Aldrich) and thereafter transferred to 70% ethanol. Eyes were embedded in paraffin and sectioned at 5 µm. For standard haematoxylin–eosin (H&E) histology staining, the sections were heated at 50 °C for 30 min, then deparaffinized in xylene (2× 5 min), and an ethanol series (99.9% 2× 2 min, 94% 2× 2 min, 70% 1× 5 min and 50% 1× 5 min) and rehydrated in water (1× 20 s). For immunostaining, the sections were deparaffinized in xylene (3× 5 min) and an ethanol series (99.9% 2× 5 min, 94% 1× 5 min, 70% 1× 5 min and 50% 1× 5 min), rehydrated in water (1× 1 min) and washed in PBS (pH 7.4,). Next, the sections were blocked with 5% normal donkey serum (NDS), prepared in PBS, for 1 h. The sections were then incubated in rabbit anti M-opsin antibody (NB110-74730, Novus Biologicals, dilution 1:250), prepared to 5% NDS–PBS–0.1% Triton X solution, with mild orbital shaking overnight at 4 °C. Next, the sections were washed for 3× 5 min in PBS 0.1% triton (PBST) and incubated with a fluorescent secondary antibody (CoraLite donkey anti-rabbit 488 nm, SA00013-6, ProteinTech, dilution factor 1:500) for 2 h in the dark at room temperature with mild shaking. Each slide contained at least one negative control sample. Finally, the slides were washed again for 3× 5 min in PBST 0.1% and 1× 5 min in PBS to ensure removal of residual detergent from the glass surface. The sections were dried and subsequently mounted using Fluoroshield mounting medium with DAPI (ab104139, Abcam).
Imaging of retinal sections
Image acquisition and analyses were performed at the Bioimaging Core Facility, Health, Aarhus University, Denmark. Retinal sections were imaged with an Olympus VS120 upright widefield fluorescence microscope (Olympus) equipped with Spectra X 7IR LED multispectral light engine and Semrock pentafilter (DAPI/FITC/Cy3/Cy5/Cy7 Penta LED HC Filter Set #F68-050) with a Hamamatsu ORCA-FLASH4.0 V2 (QE 82%) camera (Hamamatsu). Overview images were taken with an Olympus UPlanSApo 20×/0.75 air objective and associated VS-ASW imaging software. Iba1 and GFAP IF on retinal sections were imaged with the Olympus BX63 upright widefield fluorescence microscope equipped with a CoolLED pE300ultra illumination module and dedicated filters optimized for the DAPI (λex = 360–370 nm, λem = 420–460 nm), Alexa Fluor 488 (λex = 465–495 nm, λem = 515–555 nm) and Cy5 (λex = 590–650 nm, λem = 663–737 nm) channels with an Andor Zyla 5.5 sCMOS (QE 60%) camera (Andor Technology). The 40× images were taken with the Olympus UPlanFl 40×/0.75 air objective and associated CellSens imaging software.
Retinal sections and flat mounts were imaged with a Zeiss LSM 800 confocal laser scanning microscope (Zeiss) using a Plan-Apochromat 63×/1.4 oil objective. Excitation and emission wavelengths were λex = 405 nm and λem = 400–605 nm for the DAPI channel, λex = 488 nm and λem = 400–650 nm for Alexa Fluor 488, λex = 561 and λem = 400–650 for Alexa Fluor 568 and λex = 640 and λem = 650–700 for the Cy5 channel.
Images were captured with fixed settings and processed similarly. Display settings are similar and fluorescence intensities are comparable among images in the same figure. H&E histology and M-opsin immunostained specimens were imaged using an Olympus APEXVIEW APX100 microscope equipped with an Olympus U-LGPS light source. All zoomed-in images were acquired from the central region of the retina.
Porcine retina dissection
Eyes from Danish Land Race pigs (Sus domesticus) were collected at a local slaughterhouse (Danish Crown) immediately after the animals had been anaesthetized with carbon dioxide and killed by exsanguination. The eyes were transported to the Aarhus University Hospital laboratory in physiological saline solution (PSS) at 4 °C, and the time from the collection of the eyes to the commencement of the dissection procedure never exceeded 5 h. Dissection was performed in 4 °C PSS0.0 as follows: each eye was bisected at the equator with a double-edged blade and the anterior segment was removed. The posterior segment containing the optic disc was placed under a stereo microscope and the vitreous body was removed. A few millimetres from the optic disc, a segment of approximately 3 × 3 mm2 neuroretinal tissue was cut out using a self-locking chisel blade handle (VWR) equipped with a 30 microblade (BD Beaver, D.J. Instruments). Chemical solutions for storage and transportation were as follows: PSS with the following composition (in mM): 118 NaCl, 4.8 KCl, 1.14 MgSO4, 25 NaHCO3, 5 HEPEs, 1.5 CaCl2 and 5.5 glucose.
NP uptake and ex vivo culture of porcine retina
Porcine eyes were obtained from the slaughterhouse as described previously. Periocular tissue was removed, and the eye was disinfected in a 10% w/v iodine solution (polyvinylpyrrolidone–iodine complex (Thermo Fisher Scientific) in PBS). The anterior segment of the eye was cut off and blunt forceps were used to remove the vitreous. The remaining tissue was quartered and for each, a 6-mm punch out of the retina was carefully transferred to a well with 1:1 DMEM/F12 (Euroclone) medium supplemented with 2% B-27 (Thermo Fisher Scientific), 1 µg ml−1 streptomycin, 1 U ml−1 penicillin and 2 mM L-glutamine (all Euroclone). Media were aspirated and 30 µl NP solution (2 mg ml−1) was added directly onto the retinas and incubated for 30 min. Afterward, media were added and retinas incubated for 24 h.
MEA electrophysiology
A MEA with 32 channels from Blackrock Microsystems was used to measure electrical signals from the retinal tissue. The MEA was connected via an Omnetics connector to a Blackrock Microsystems Cereplex Direct dedicated data acquisition. Data was sampled at 30 kHz, high-pass filtered at 250 Hz and further filtered for 50-Hz line noise by a built-in Blackrock Line Noise Cancellation filter (filtering at 50 Hz, 1 s, soft synchronization). For all recordings except those used for dose–response analysis, a 50-Hz notch filter was additionally applied in MATLAB to attenuate residual line-noise artefacts. Data were analysed using custom MATLAB software and Python scripts. All electrophysiological experiments were carried out inside a Faraday cage.
After placing the retinal tissue on the MEA with the retinal ganglion cells facing upwards, 5 µg of hg-C3N4 NPs dispersed in 20 µl of PBS were added to tissue and allowed to settle for around 15 min. Afterward, light stimulation was applied using a 450-nm homemade LED system with 1-ms pulses with one pulse per second (1 Hz). The recording length was at least 30 s. The resulting whole data trace for each of the 32 channels were segmented into traces of 1 s duration (minimum 30 traces), initiating at the stimulus artefact. These traces were then averaged to improve the SNR. Firing-rate analyses were performed on non-averaged traces to avoid emphasizing residual line-noise artefacts, and spikes were detected using a median absolute deviation-based thresholding approach. In brief, spikes were detected on each channel using a threshold set at 4.0× median absolute deviation of the baseline noise, calculated for each trace independently. Firing frequency was quantified by counting detected spikes within a 1–100 ms window following light onset for each stimulus. All spike detection and firing-rate analyses were implemented using custom Python scripts.
The chemical solutions for experiments were as follows: PSS1.6 with the following composition (in mM): 119 NaCl, 4.7 KCl, 1.17 MgSO4, 25 NaHCO3, 5 HEPEs, 1.6 CaCl2, 5.5 glucose, 1.18 KH2PO4 and 0.026 EDTA. PSS0.0 refers to PSS1.6 where CaCl2 has been omitted. PSS1.6 was heated to 37 °C and oxygenated before all experiments to ensure a physiological environment during electrical measurements.
Tetrodotoxin (TTX) citrate was obtained from Hello Bio Reagents (HB1035). TTX solutions were prepared by creating a stock solution of TTX in PSS1.6 of 1.0 M concentration. From this solution 1 ml aliquots of 2.25 mM concentration were created for use in future experiments. All TTX solutions were stored at −20 °C between experiments. For TTX control experiments, a volume of 50 µl of the TTX solution was applied directly to the tissue sample.
Statistics and reproducibility
Statistical analyses were performed using GraphPad Prism (versions 9.3.1 or 10.4.1) or R (version 4.3.0). Statistical significance was assessed using unpaired two-tailed t-tests or one-way ANOVA and Tukey’s test for multiple comparison unless otherwise stated. For representative graphic figures, each experiment was repeated three times independently with similar results.
Source: https://tinyurl.com/3aaw6e7z via nature biomedical engineering